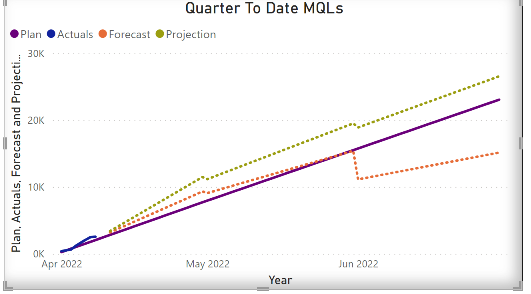
I am having issues with the Quarter To Date Line Chart for cumulative numbers, expecting to see cumulative numbers growing till the quarter end but there is a drop down after every month.
My Current Logic
Cumulative Actuals plus Cumulative MQL Projection =
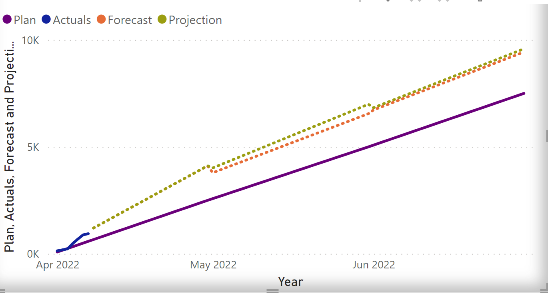
I can not provide the PBIX due to data security reasons but i did provided the screen shots and the query for calculated measures used for the Line chart. The expected outcome should be cumulative numbers increasing but there is a drop down after each month and starting new month, which is something is not aligned when the month changes and not able to manipulate the logic. This is with the Projection Green line representing in the Screenshot.
Appreciate your response.
So overall there are 4 logic for the calculated field and measures we have created.
One more logic here we used
MQL Forecast - Remaining Daily Average =
if(eomonth(‘Global MQL Forecast’[Old Style Month],0) < today(),
0,
‘Global MQL Forecast’[MQL Forecast] //need a way to bring in actuals and subtract MTD actuals from forecast
/
calculate(count(‘Date’[Date]),filter(‘date’,‘Date’[Old Style Month]=‘Global MQL Forecast’[Old Style Month] && ‘Date’[Date] >= today())))
Hi @Akaur. To help us further analyze your current state and visualize your issue, you could create a sample dataset and PBIX that illustrates both your issue and that would let you mark-up a screenshot to display the desire outcome.
Hi Greg,
Thank you for your response, I am unable to provide test file. But can try to explain what we are trying and getting an error. Here all the logics have provided below but need some chang to show flow of data having cumulative numbers growing.
Our Projections are based on the actuals and need to map out QTD graph having (Cumulative Actuals+Cummulative Projections)
Graph is showing a gap or drop down between end of the month and start of the month
Projection line is showing logic built provided in “a” which is based on other 3 logics provided in “b”,“c”,“d”.
a. Cumulative Actuals plus Cumulative MQL Projection =
If(Calculate(Sum(‘Date’[Date]))>TODAY(),
([Cumulative Actuals] + [Cumulative MQL Projection]),"")
I tried creating Dummy File but not able to pull expected Outcome, have kept all the calculations based on what I needed for QTD chart.
Actuals will be coming till the date from Automated System
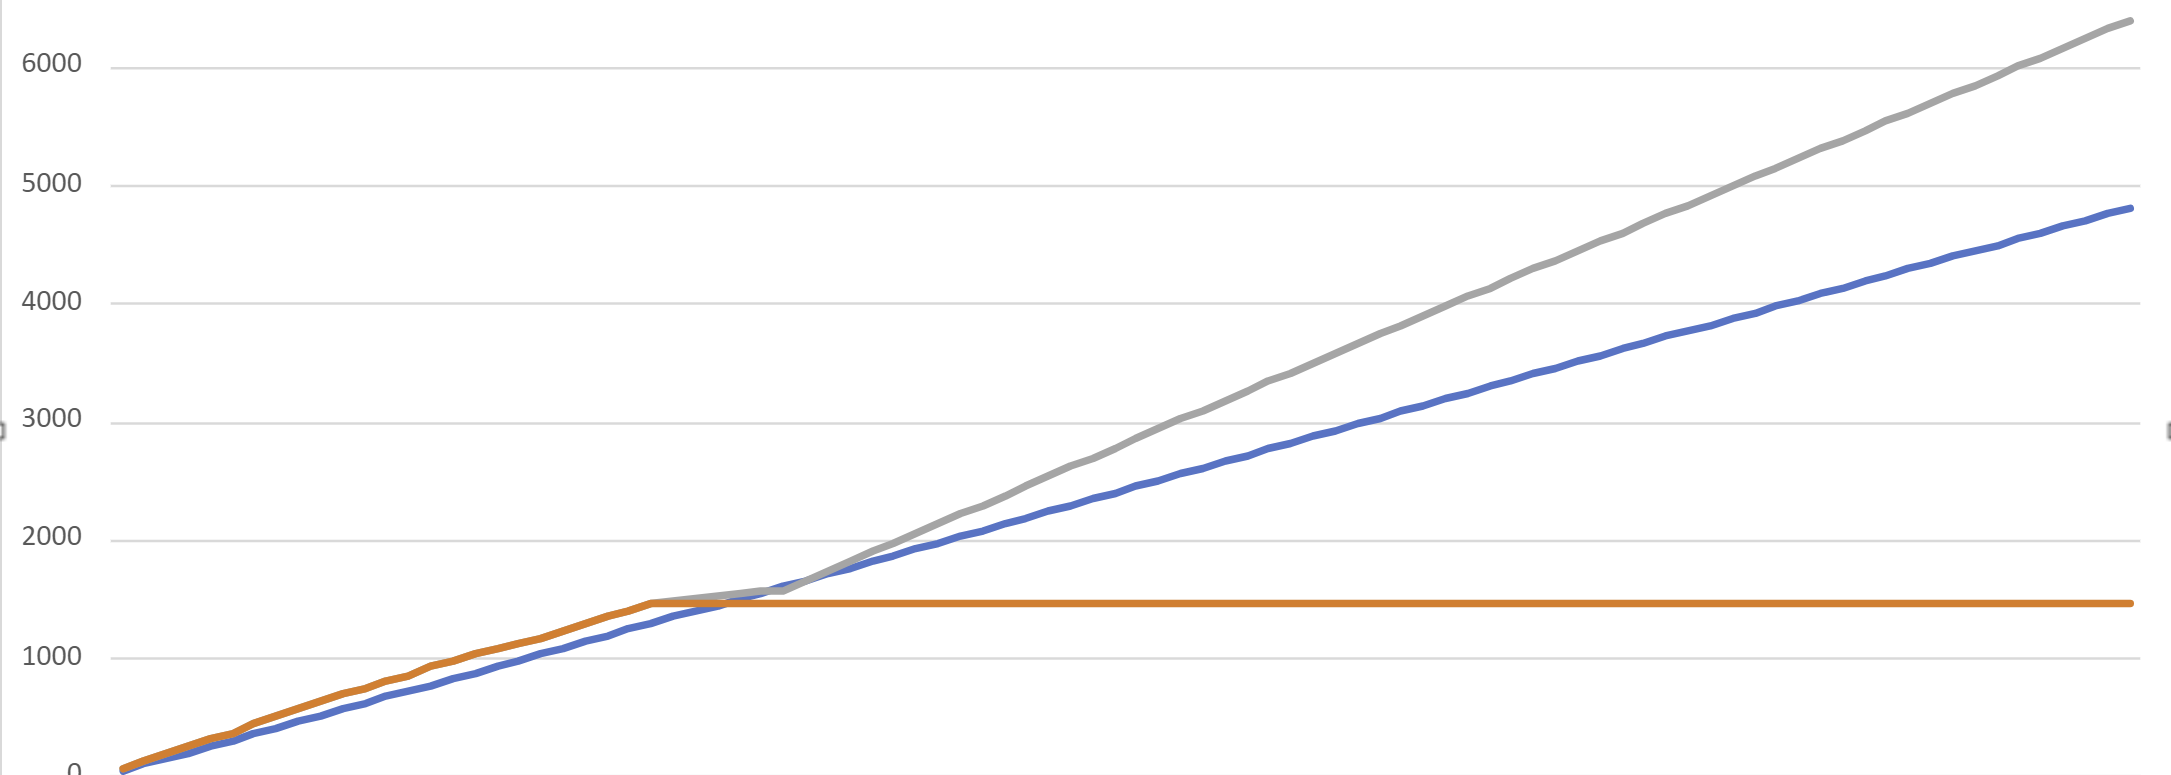
Forecast would be combination of Actuals + Forecast, Actuals should represent till the date and forecast should be the cumulative numbers based on actuals and move from the future date till the Quarter end but should go upwards.
Projection is also based on Actuals and show future days till the quarter end based on the actuals showing cumulative numbers.
The expected outcome should be
Actuals till the date and Forecast,Projections from tomorrw till the QTD going upwards as those are cumulative numbers based on Actuals. So should not have any drop down.
One thing that looks odd in the DAX however is Sum(‘Date’[Date]). I don’t think I have ever summed a date column. Might work with Max(‘Date’[Date]) because the Sum(‘Date’[Date]) might be working within the context of MonthYear which is what your X-axis shows.
Another suggestion might be to rework the DAX with DATESQTD and see if that helps.
There is something we tried for Plan table to fix this but this DAX is not working with Projection and Forecast.
Cumulative Plan (Quarterly) =
VAR MonthOfQuarter = (roundup(calculate(sum(‘Date’[Month Number])) / 3,0) * 3) - 2
VAR MonthNumber = calculate(sum(‘Date’[Month Number]))
VAR MonthlyPlan = calculate(sum(‘MQL Plans’[MQL Plan Daily Average])) * calculate(sum(‘Date’[Day of Month]))
VAR OneMonthPriorTotal = CALCULATE(SUM(‘MQL Plans’[MQL Plan]),PREVIOUSMONTH(‘date’[date]))
VAR TwoMonthPriorTotal = CALCULATE(SUM(‘MQL Plans’[MQL Plan]),previousmonth(PREVIOUSMONTH(‘date’[date])))
While our users and experts do as much as reasonable to help you with your inquiries, not all concerns can be attended to especially if there are some learnings to be done. Thank you!