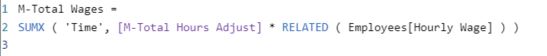
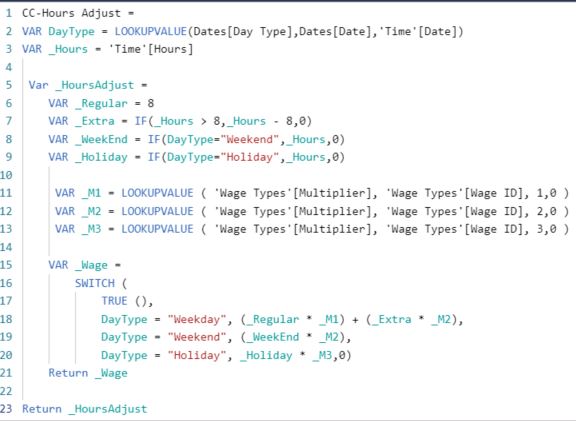
Timesheet data is common to many organizations, and the associated wage costs often are subject to certain rules. Employees are often paid wages based on how many and when hours are worked, and in this exercise, employees are paid as follows:
Normal hours (up to 8 hours per day) are paid at straight time
Overtime hours (above 8 hours per day or on weekends) are paid at time and-a-half
Holiday hours are paid at double-time
Time data is pre-loaded and modelled in the attached PBIX file, with one time entry per employee per day, one timesheet per employee per week, one year of data (employees work every day; not realistic but perhaps useful for an exercise), ten employees and their hourly rates, and three departments. A connected standard dates table and a disconnected wage type table are also provided.
Your task
This week’s Problem of the Week consist of two parts:
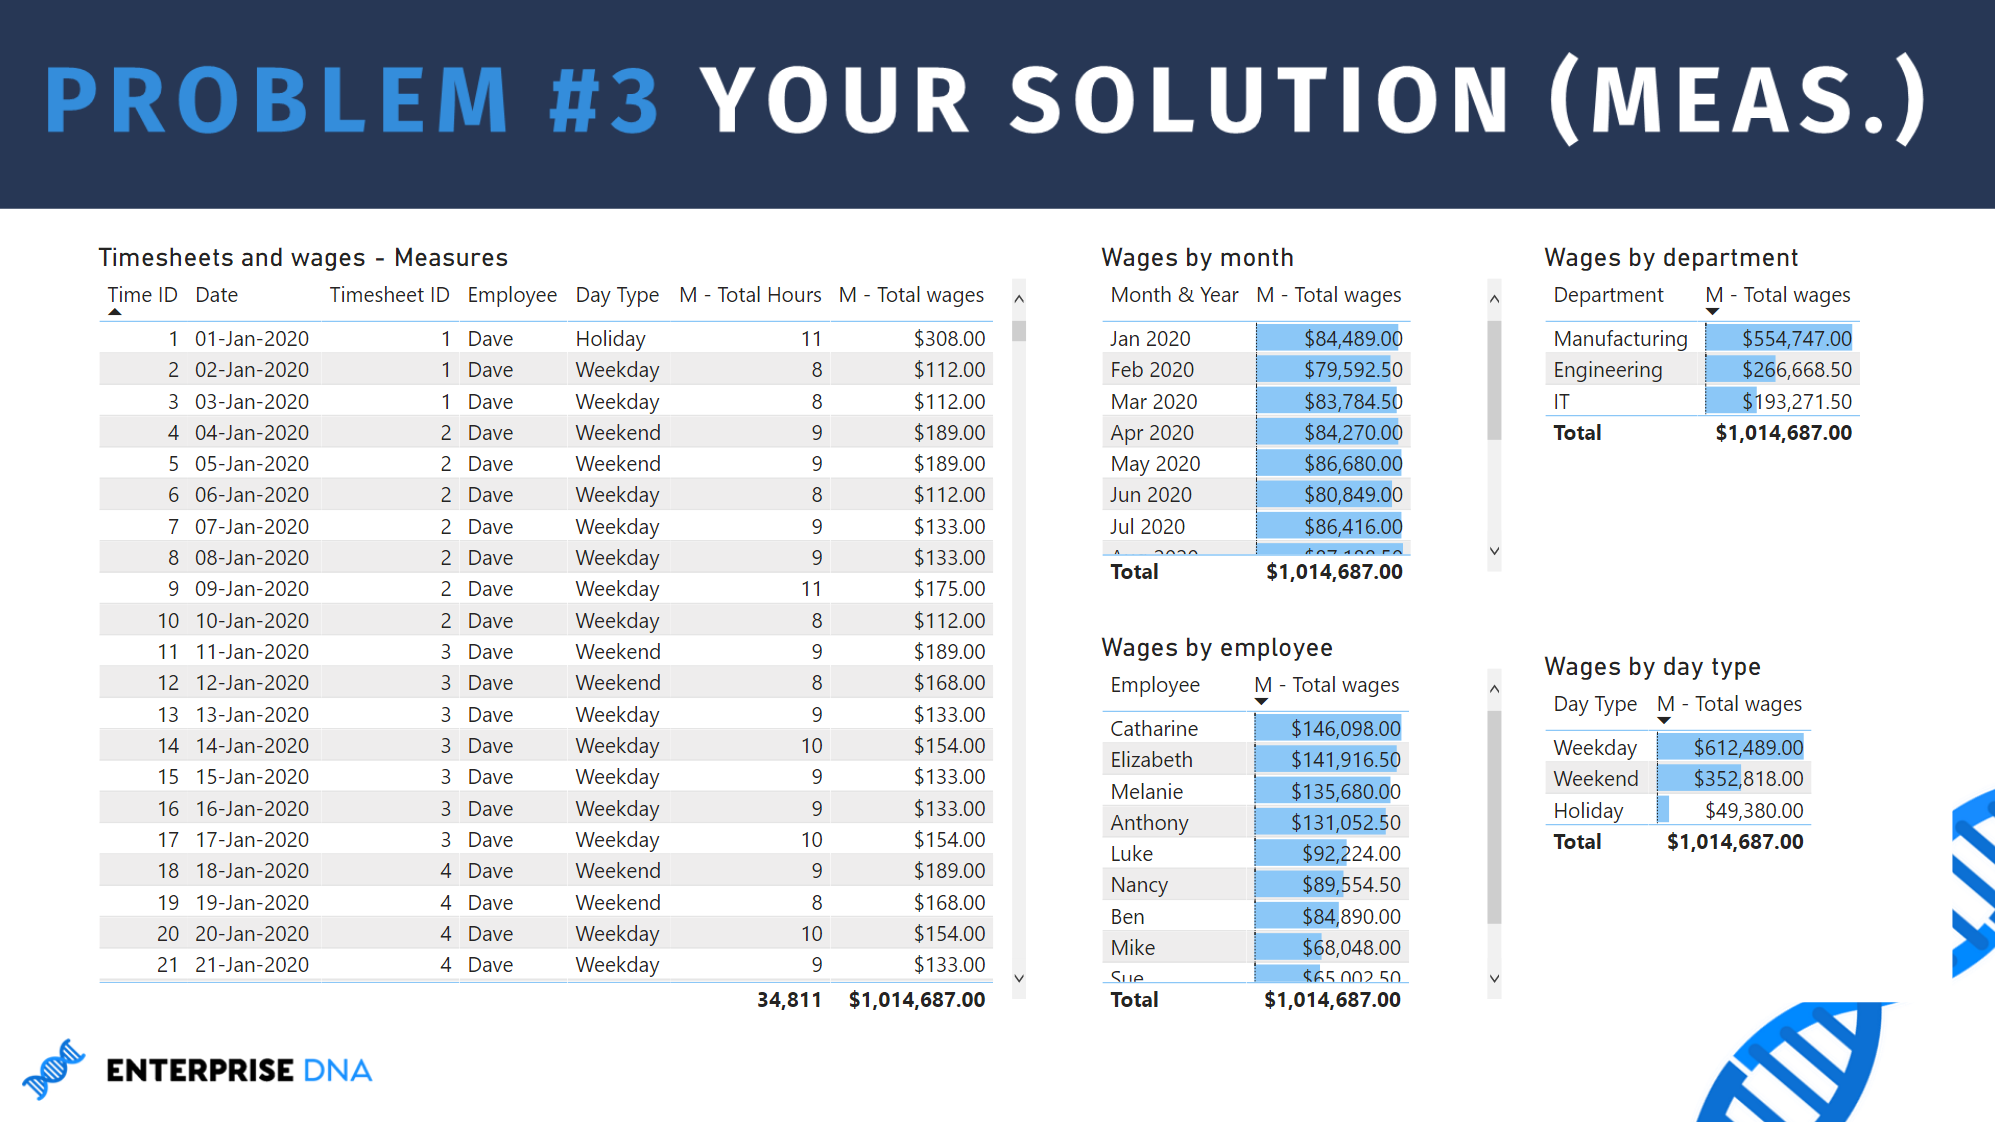
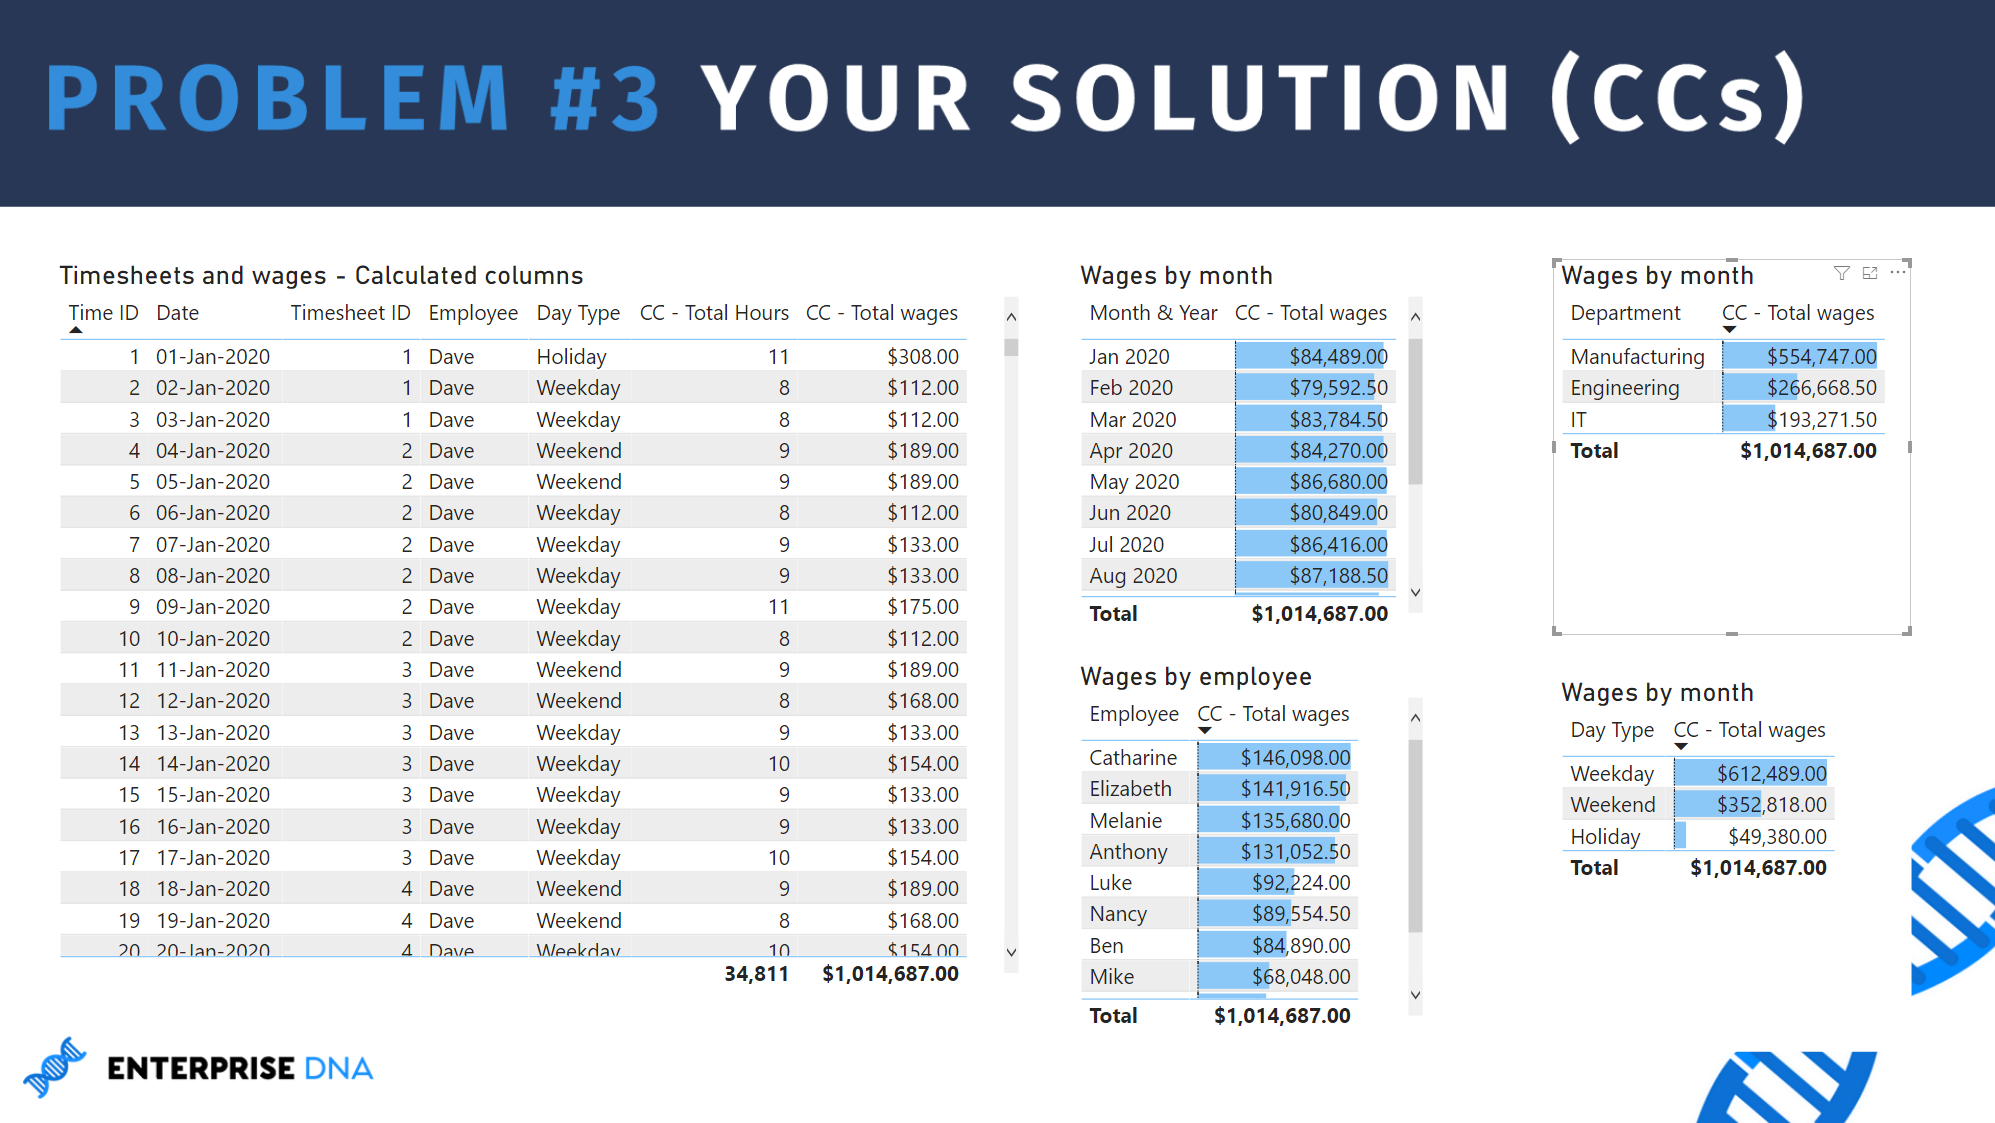
Part 1 is to pursue and develop two DAX solutions, one purely using measures, and one using purely calculated columns, to calculate and present the hours, wage type, and wages by month, employee, department, and day type.
Part 2 of the task is to describe the pros and cons (or benefits and limitations) of each approach.
We encourage you to identify any difficulties or issues, and hopefully the robust community discussion will provide direction. Learning is not the destination but rather the journey, so effort rather than achievement is the goal.
Important
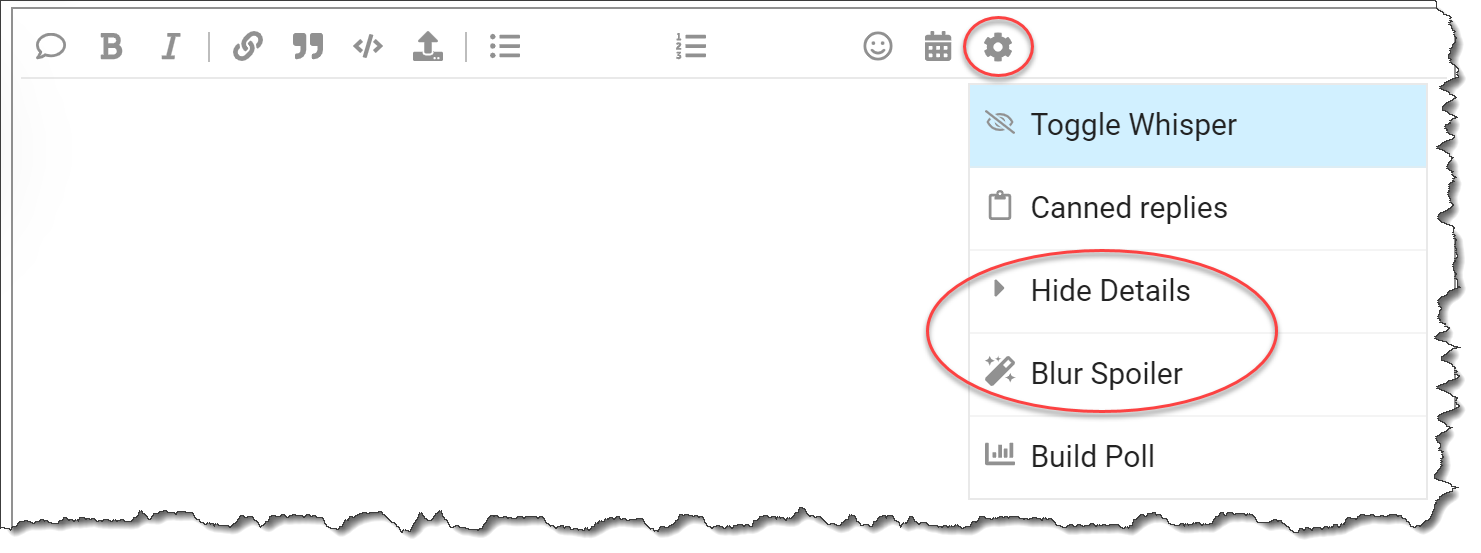
We ask that if you post anything directly related to a solution to please use the “Hide Details” or “Blur Spoiler” options within your post. This will prevent people who have not yet completed their solution from seeing things they might not want to see yet and could influence their solution.
To use these options, just select the text or image you want to hide, click on the gear icon on the top right at the top of your post and select either Hide Details or Blur Spoiler.
Note that this is a DAX-only challenge, so no Power Query even if that is what you would choose to use outside of this challenge.
Eligibility for the Drawing
To encourage participation, we will be doing a drawing of five random participants each round to receive one of these cool Enterprise DNA vinyl laptop stickers:
To be eligible for the drawing, just send an email to problemoftheweek@enterprisedna.co before 11:59pm ET, Tuesday, January 12, 2021 indicating you’ve successfully completed the challenge, and please provide your mailing address for us to send the sticker if you’re selected.
We hope you find this initiative fun, challenging and helpful in continuing to build your Power BI skills. All of the information you will need is contained in the files within this post. If you have any questions or comments, just message @BrianJ or @Greg in this forum thread.
Here is my submission for the week. I can definitely nod in agreement with @BrianJ re going back to measures after doing the calculated columns. I think pen and paper as a starting point to think about the process is going to be a key lesson for me from this exercise… and perserverance.
Sue eDNA POTW 3 @SueBayes.pbix (682.2 KB)
The answers are identical for both approaches. I have come to slightly different totals to jbressan. I think this arises from different readings of the overtime rules. I have calculated time and a half for work over eight hours on a weekday and for all time worked on a weekend. I think that jbressan has read the second rule as time and a half for time worked over eight hours both on a weekday and weekend.
As for my approach to a solution. I dived into writing measures and quickly regretted it.
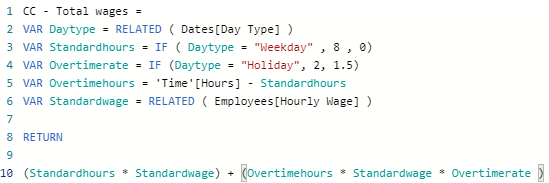
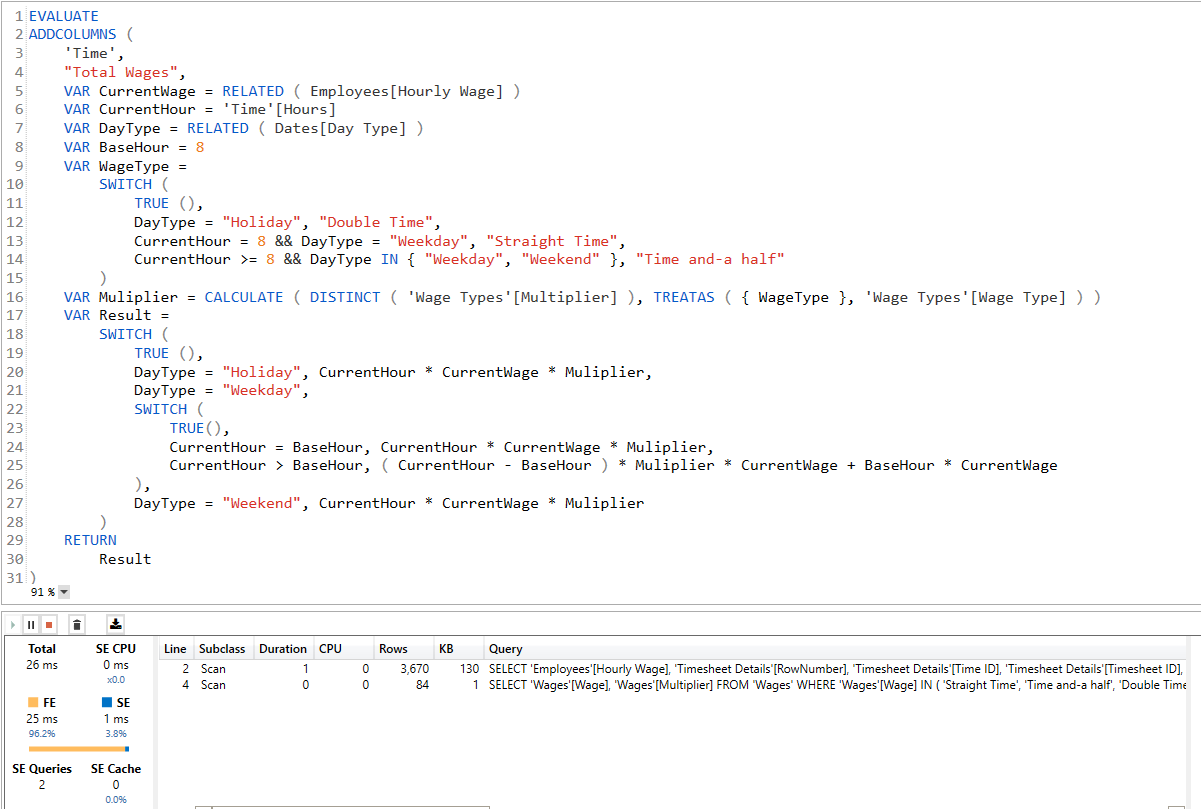
I found that it was easier to start thinking through the problem using calculated columns. I was able to write several calculated columns on the Time table quite quickly that gave me the wage rate, day type, overtime hours and overtime multiplier as separate physical columns in the Time table which enabled a calculation of Total wages at a row level. I tidied this up for the solution by consolidating the series of Calculated columns into Variables so that only one physical Calculated Column was required for the solution:
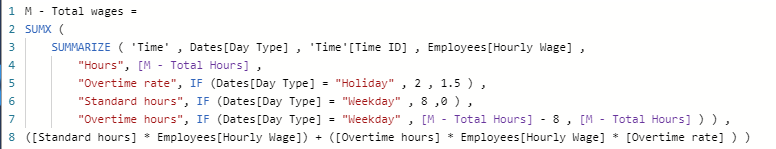
Solving the calculated column approach made me realise that in order to solve this using a measure I would need to create a table function in DAX that I could iterate over row by row to complete the same calculation as at the end of the Calculated Column solution. I had to go back to Sam’s lecture on table functions from Mastering DAX Calculations to remind myself of the DAX table functions, and after a bit of trial and error decided to use the SUMMARIZE function building on the [Time] table to create the virtual table required. I created a Test table to check the DAX (I have left this in the solution file but would normally delete this after testing). I was then able to put the test table code into a measure and SUMX over the same formula as I used at the end of the Calculated Column solution:
Which approach is better? It was clearly quicker to get to a Calculated Column solution from a standing start. But if this was my data set and I was doing more analysis on it I wouldn’t want to be creating physical columns everywhere - for ease of use as much as for file size or performance reasons and so would aim to use a Measure solution wherever possible.
All the best and I look forward to seeing other people’s solutions and approaches (I can peek now).
I wrote my query and then compared the total wages with other users who had already submitted. Realized my query had an issue because for weekend also i was only using the multiplier of 1.5 for overtime hours … Made the changes and submitting. My solution is very simplistic because i am using switch and sumx. i believe using better dax query can make the solution more elegant from performance perspective.
Here’s my submission for POTW #3. Big thanks to @Greg for development of a really interesting and relevant problem.
I found the compare and contrast of measures and calculated columns here quite interesting, since I’d never done a problem entirely in measures before and then reworked the whole thing in calculated colums. Here’s what I took away from that:
Summary
Measures:
Fully dynamic within the course of a report session
Only calculated when needed, saving space and reducing refresh time
Keep data model from getting cluttered with excess columns
Calculated columns:
Somewhat easier to write, since row context is inherent
No additional work needed to be done to fix totals - they were correct right out of the gate.
For intensive calculations, may be a better choice than measures due to performance issues (but PQ may be an even superior choice)
Have their uses, but in most cases if I need the data in a column rather than in a measure, I will do it in Power Query rather than as a DAX calc column
Note: my file looks a little different, since I developed this solution while helping test the initial development of the problem, before we added in the spiffy background images, but the data and results are the same.
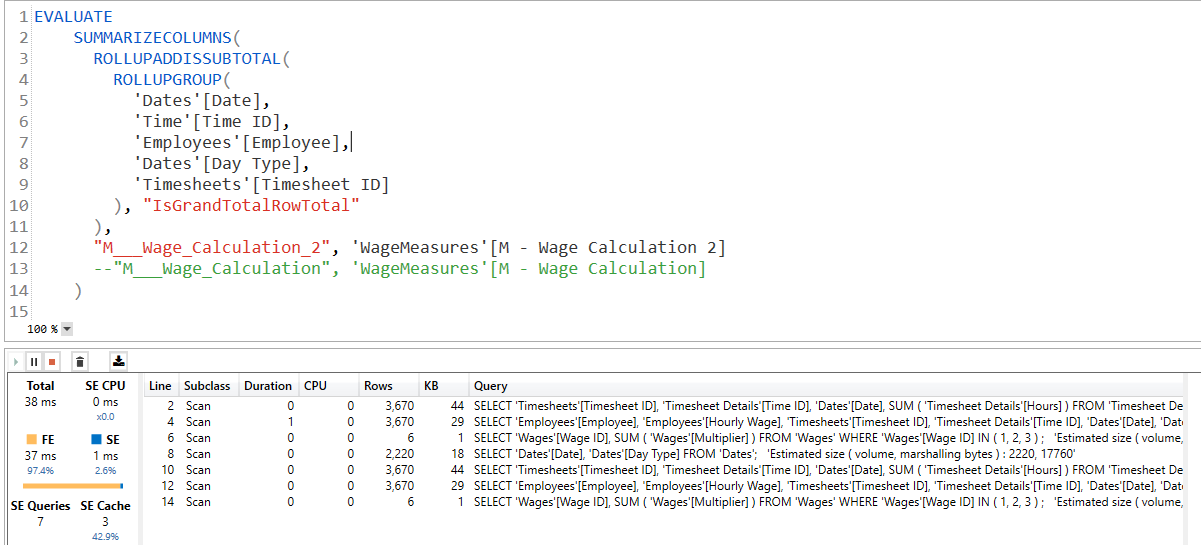
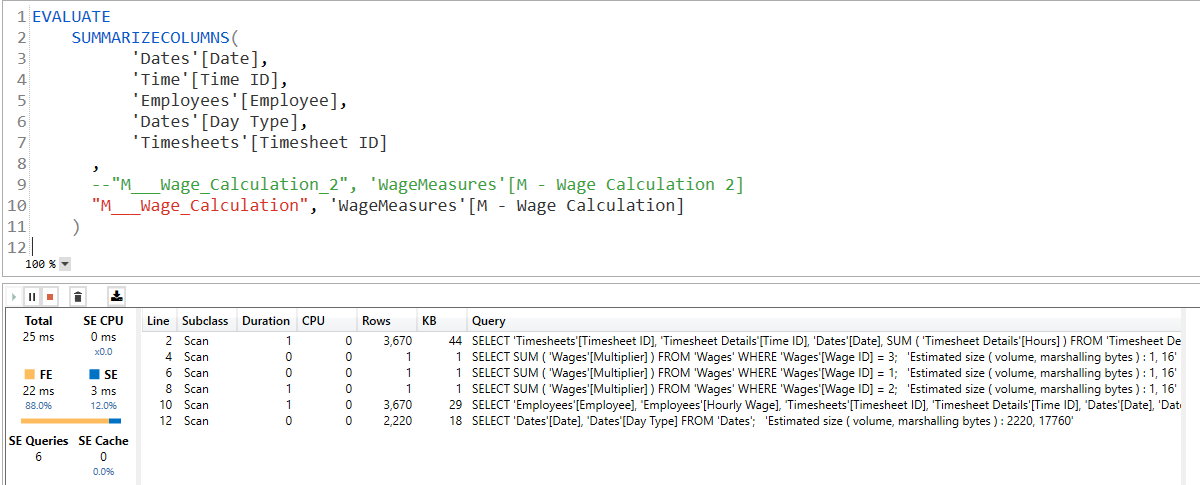
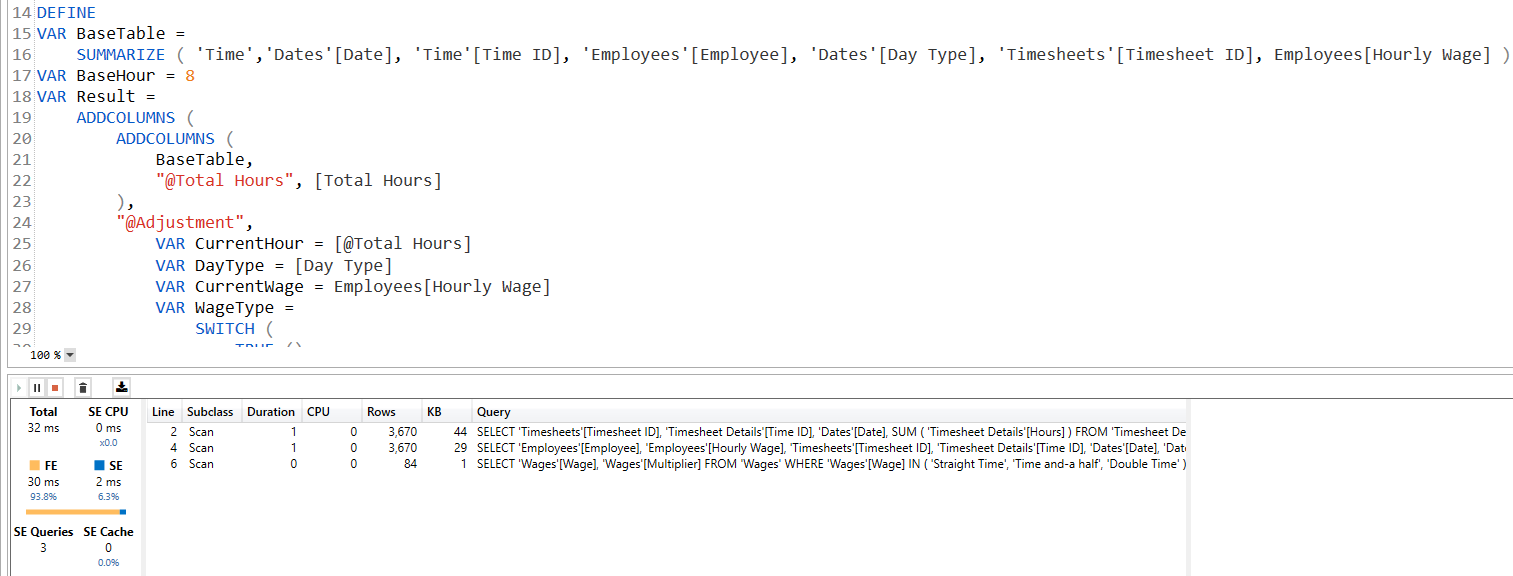
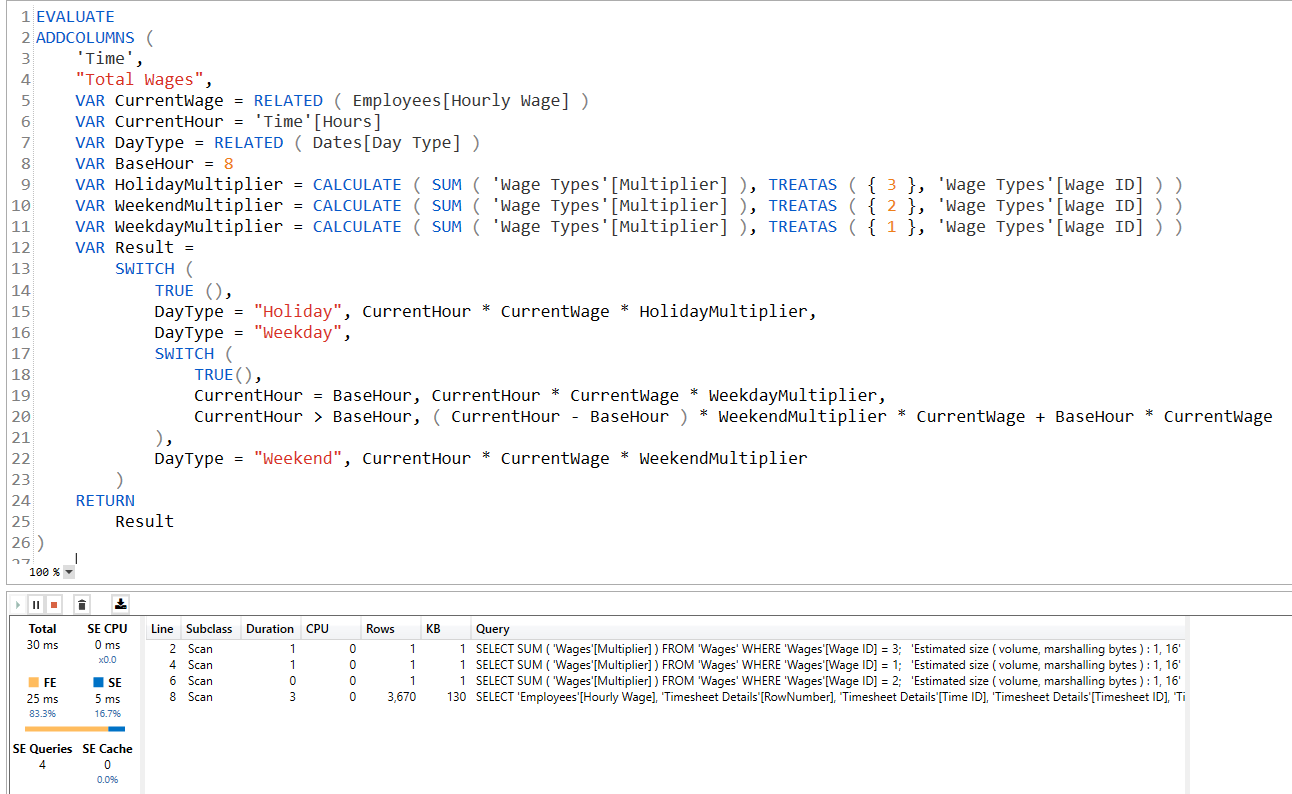
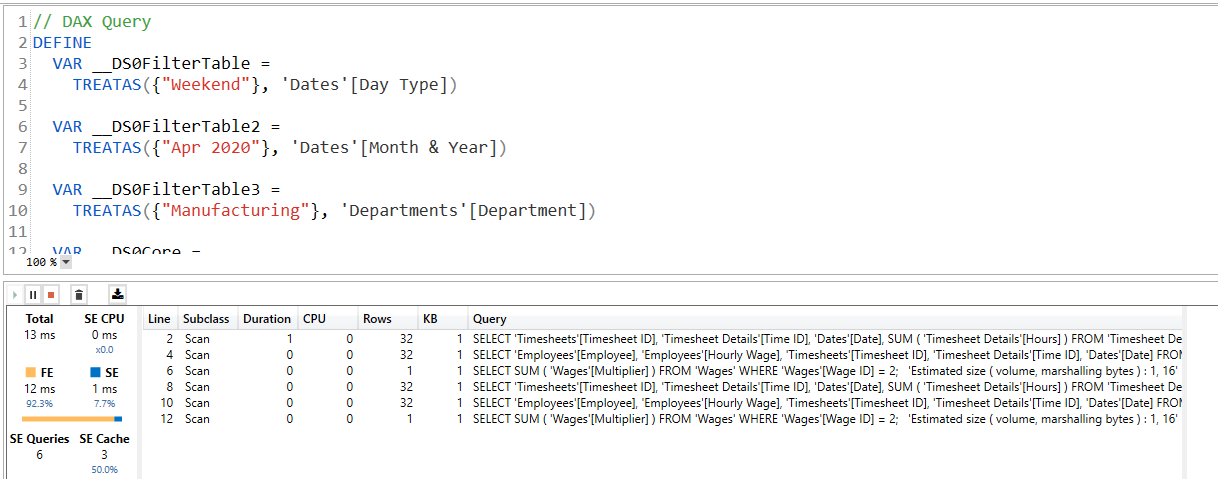
As usual I took the approach of precomputing everything and as my own found best practice I believe in only creating one single measure for each task, no matter what!
All three versions have been optimized as much as I could.
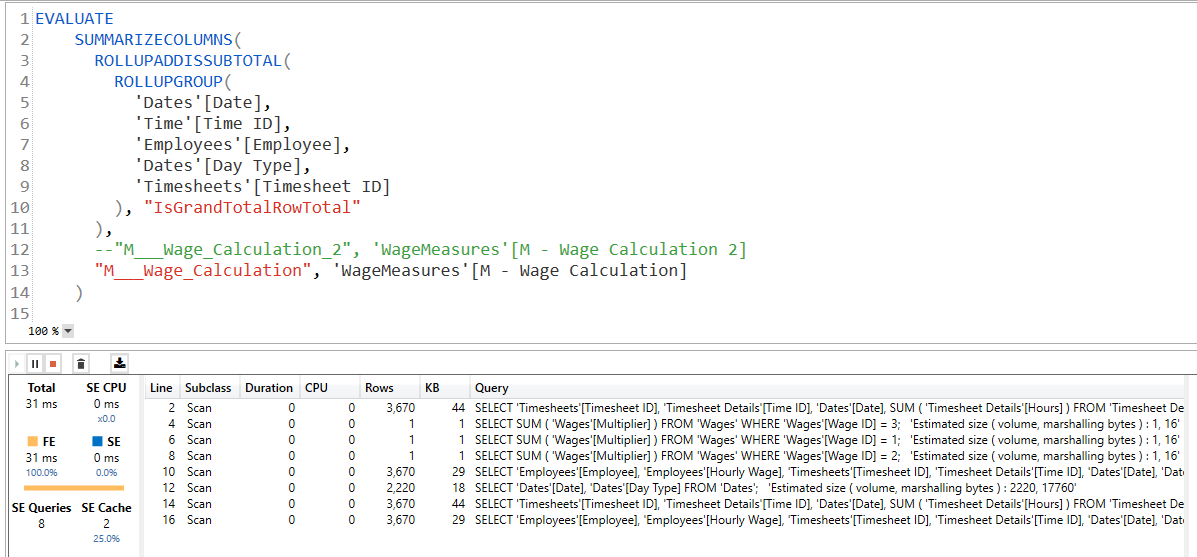
If Grand Total has to be included then measures run between 30-40 ms
All of the above performance results are applicable in a scenario where you show 3670 rows at once without any selection over slicers, but since PBI uses TOPN to limit the result in a table visual to 502, the queries will run in less than 15ms, and xmSQL always fetches the data cache that is similar to the number of rows displayed in the visual, which is a good thing.
Here is my submission. The visuals aren’t anything special - just tables to view the data and make sure it appears to be calculating correctly.
Overall, I didn’t find much of a difference between using either a measure or a calculated column given that the DAX is essentially the same. (Note - I only did a calculated column for the wages as the hours are already there). But overall, I tend to stick with measures versus the extra column when I can.
Definitely enjoyed this one as it did take me some time to figure out the approach. My initial attempt used variables and way to many IF statements which killed performance. Thanks to @Sue for the suggestion of using the pen and paper as a starting point as I went back to the starting board and found a much easier way.
I prefer using measures as a best practice for performance. The DAX is very similar between the two, but the calculated column gives the advantage of seeing the results in PBI.
I started with the measures. My strategy was to split it down to small pieces. Used IF statement as the dataset was small.
Per @Greg’s response, the goals of POTW were to:
a) have everyone address the same problem using the same tools, so that we could all compare/contrast/learn from the different approaches taken
b) not be onerous - make them challenging but not super time-consuming to hopefully spur widespread participation
Thus, we are not asking for anything more than the solution scope laid out in the problem.
**BUT… if the problem inspires you to carry your deliberate practice into other areas, such as visualization, then by all means…go nuts. I was working last night on testing @haroonali1000’s POTW #4 problem, and when I finished, it just seemed like a good context in which to try @MudassirAli’s combination of small multiples and calculation groups - totally unrelated to Haroon’s task.
Bottom line - however you all choose to use these initiatives to improve your skills is great. The key is just jumping in and getting your hands dirty… Huge to you and everyone else who’s been doing that. And if you haven’t yet, give it a go - we think you’ll find it a very worthwhile investment.
I just wanted to take a moment to thank those who reviewed and participated in this week’s DAX problem, Timesheet and Wages.
My solution has been posted to YouTube, but I’ve written-up some the thoughts I had while solving this problem.
Setup:
For both the calculated column and measures pages, I added some basic slicers, a reset slicers bookmark and button, and a table with basic time info
My Solution using Calculated Columns:
For me, my place of comfort is small steps, so I started with the smallest calculation I could; breaking down the daily hours into their regular, overtime, and holiday components.
(I’m verbose coder by nature, and as I don’t approach coding as if I’m writing for myself now, but rather for myself (or whoever will be maintaining the code) in 6 months when I’ve forgotten my train of thought and need to understand and enhance my code, I’ll happily err on the side of readability over performance most of the time. I know this is by no means a performance solution, but in my opinion is very readable and easy to understand.)
So, to get the [Regular Hours], I opened the [Time] table and create a calculated column for [Regular Hours] (using the “CC-” prefix)
First I grabbed the [Hours] entry and place into a variable
(I always use an underscore prefix on my DAX variables as I find it makes my code easier to read and also ensures I don’t accidentally choose a column by mistake when using the built-in Intellisense in the DAX editor window)
(Also, I use the keyboard shortcut of CTRL + the mouse wheel to increase or decrease the font size in the DAX Editor window)
Next I need to figure out the day type, so I create boolean (1/0) variables to calculate if it’s a holiday, weekend, or regular day
I can leverage the data model to see if it’s a holiday by checking the related Dates[IsHoliday] value
I can again leverage the data model to see if it’s a weekend day by checking if the related Dates[Day Type] value is “Weekend”
From there, it’s a regular day if its not a holiday or weekend; as the “Holiday” and “Weekend” fields are 1/0’s, I can use a simple sum to calculate if it’s a Regular day (a 1/0 as well)
Now I can calculate my result, using a SWITCH TRUE statement to return
BLANK’s if it’s a holiday or weekend
For regular days, if the hours are 8 or less, use the hours, otherwise 8
Then use RETURN RESULT
Next, I can use the code from the [Regular Hours] column I just calculated to create another column for the [Overtime Hours]
I use mostly the exact same code, only changing the RESULT calculation to return BLANK for a holiday, all the hours if it’s a weekend, or the hours over 8 if it’s a regular day
Finally, I can use the code from the [Regular Hours] column again to create another column for the [Holiday Hours]
Again, I use mostly the same code, again only changing the RESULT calculation to return the full hours for a holiday and BLANK otherwise
So, now I’ve got my component hours calculated for each day and its time to calculate the associated wages
Now on to a new calculated column for the [Regular Wages]:
CC-Regular Wages =
VAR _Hours = 'Time'[CC-Regular Hours]
VAR _WageType = "Straight Time"
VAR _Rate = RELATED( Employees[Hourly Wage] )
VAR _Multiplier = LOOKUPVALUE( 'Wage Types'[Multiplier], 'Wage Types'[Wage Type], _WageType )
VAR _Result = _Hours * ( _Rate * _Multiplier )

RETURN
_Result
Again, let’s get the hours, but this time we already have it calculated in our [Regular Hours] calculated column, so lets just use it
I also set a variable for [Wage Type] to “Straight Time” as I’ll use this later to get the wage multiplier from the disconnected [Wage Types] table
I can get the employee’s hours rate from the [Employees] table in the data model
To get the hourly rate multiplier, I need to retrieve the multiplier associated with the wage type, and I can use the LOOKUPVALUE function to get that from the disconnected [Wage Types] table
Then I calculate the RESULT being the hours x the rate x the multiplier, and finally RETURN RESULT
I can use similar code to calculate the [Weekend Wages] and [Holiday Wages]; so copy-and-paste the [Regular Wages] code and
For [Overtime Wages], change the [Regular Hours] column to [Overtime Hours] and change “Straight time” to “Time-and-a-half”
For [Holiday Wages], change the [Regular Hours] column to [Holiday Hours] and change “Straight time” to “Double Time”
So, now I’ve got the component hours and component wages, and I have the total time from the data table, so its time to make a total wages column; this is just a simple sum using the component “wage” columns
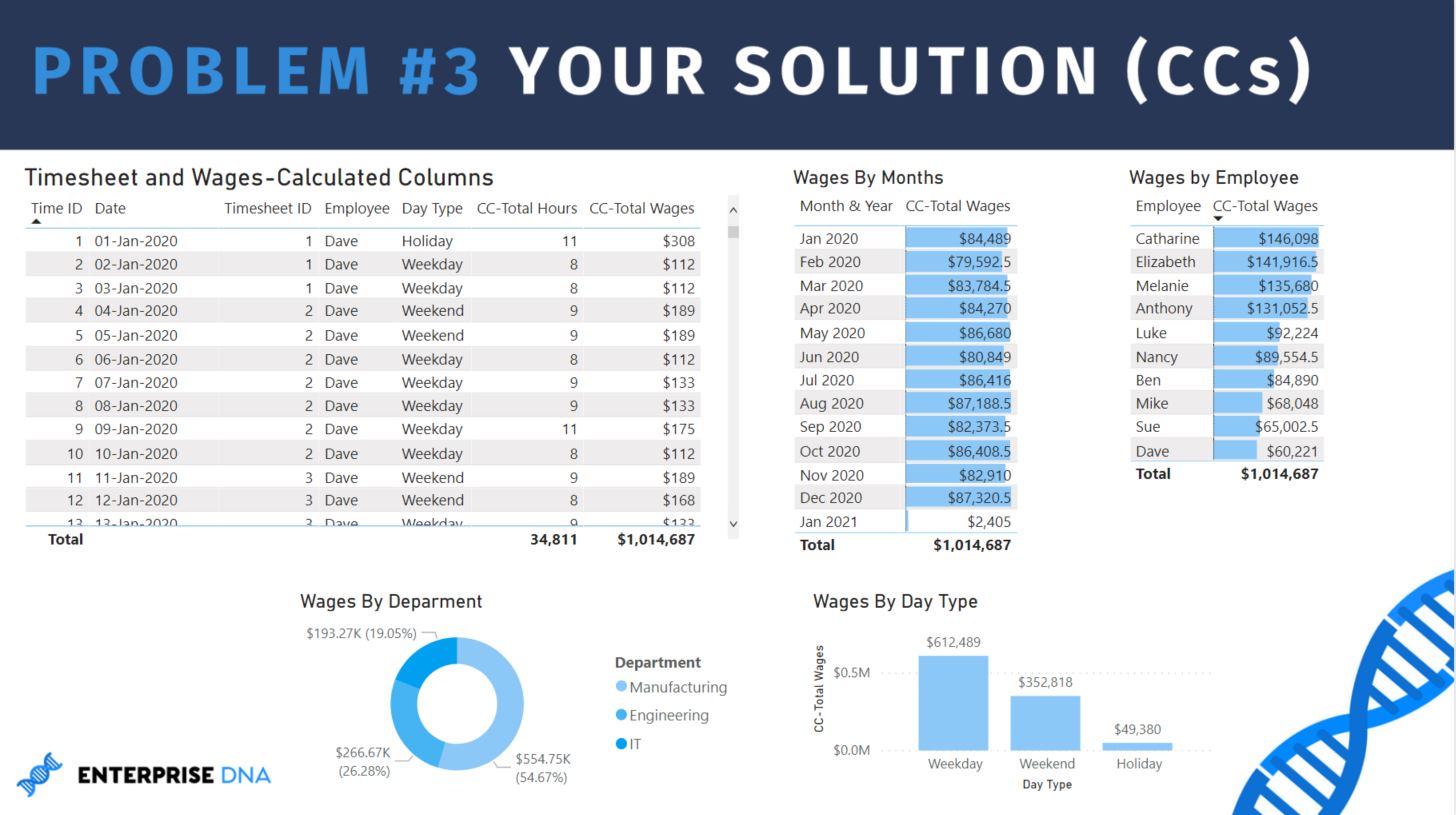
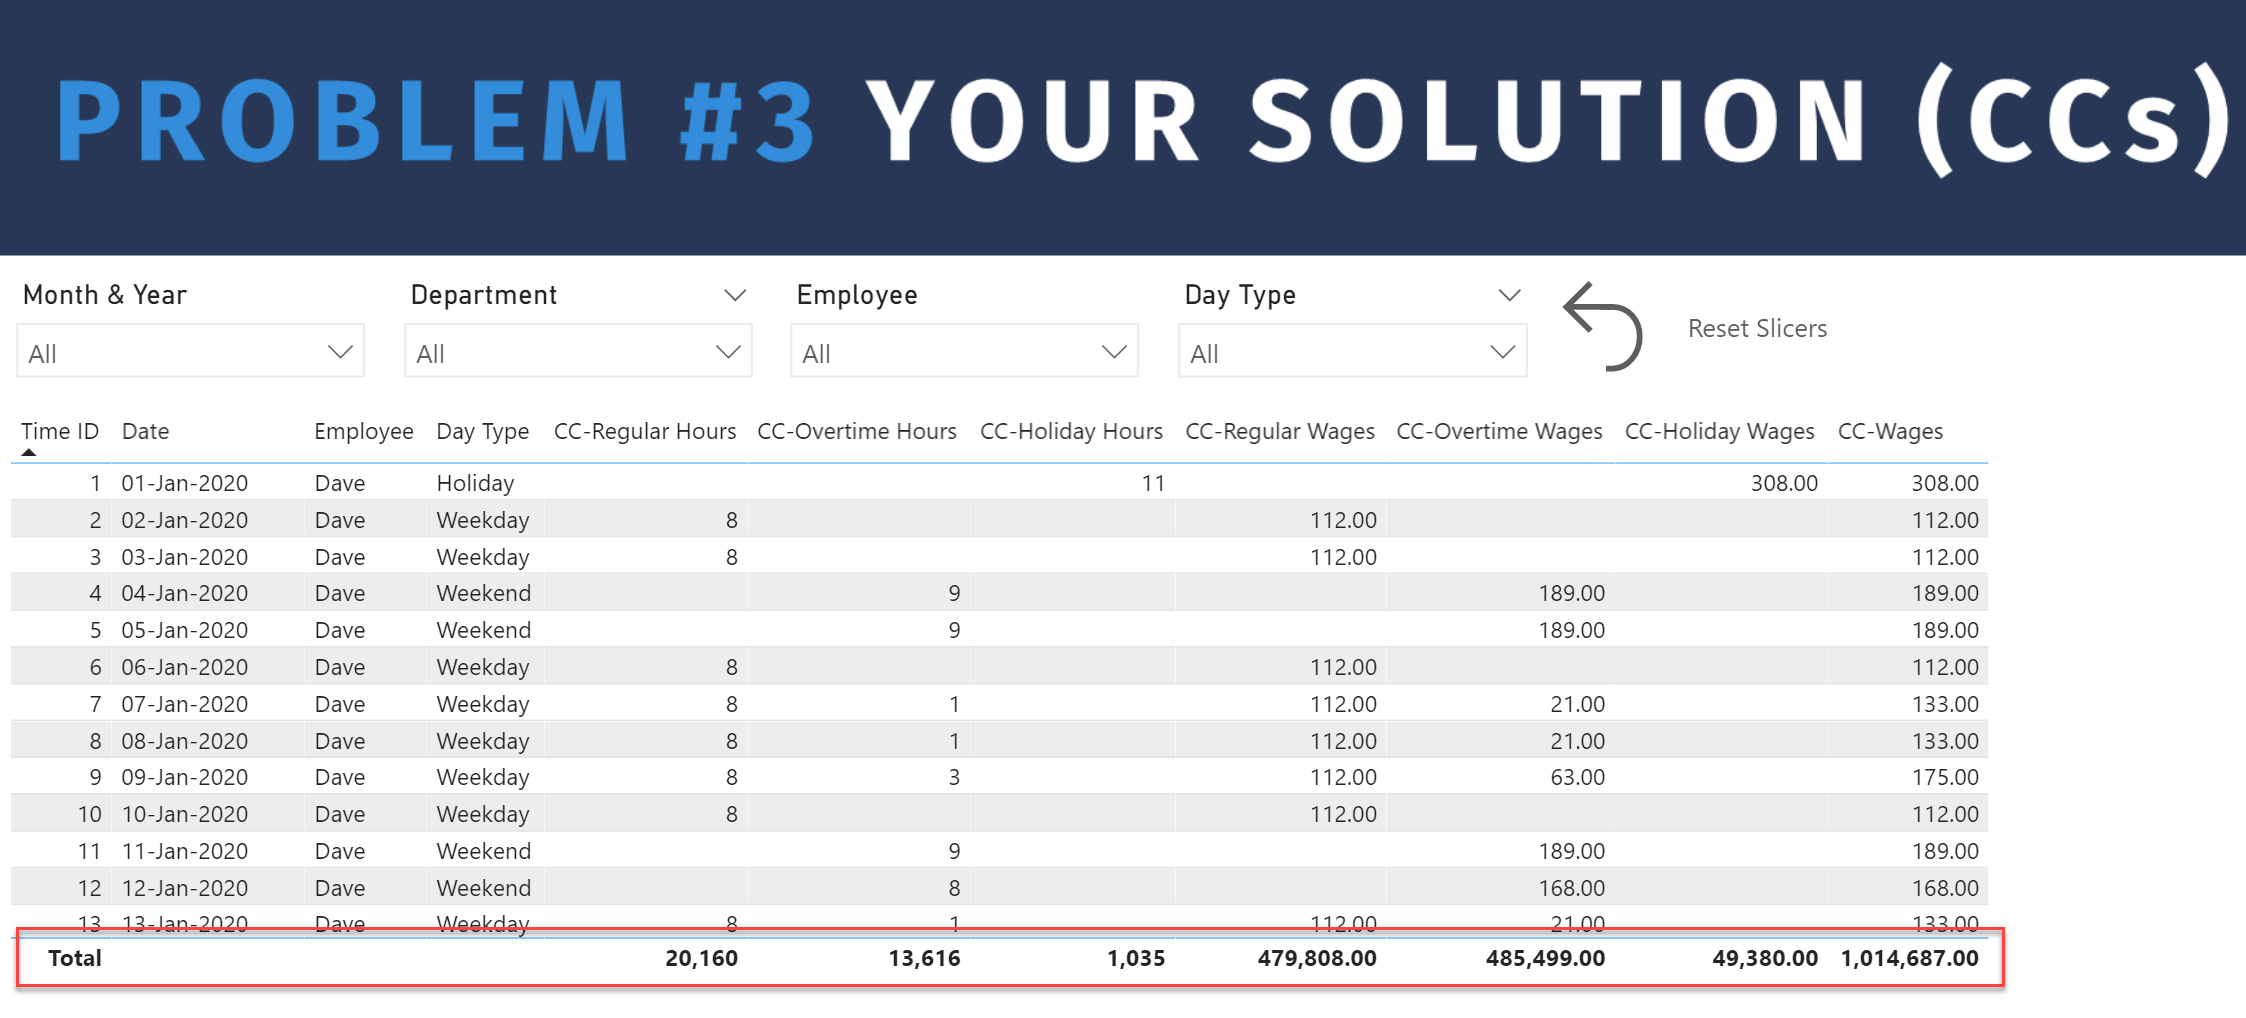
Now, I went back to the CC page, and added these newly-calculated columns into the table:
Add the [Regular], [Overtime], and [Holiday] hours
Add the [Regular], [Overtime], and [Holiday] wages
Finally, add the [Total Wages] column
As you can see, we have TOTAL values for all our calculated columns that are automatically shown in the table visual
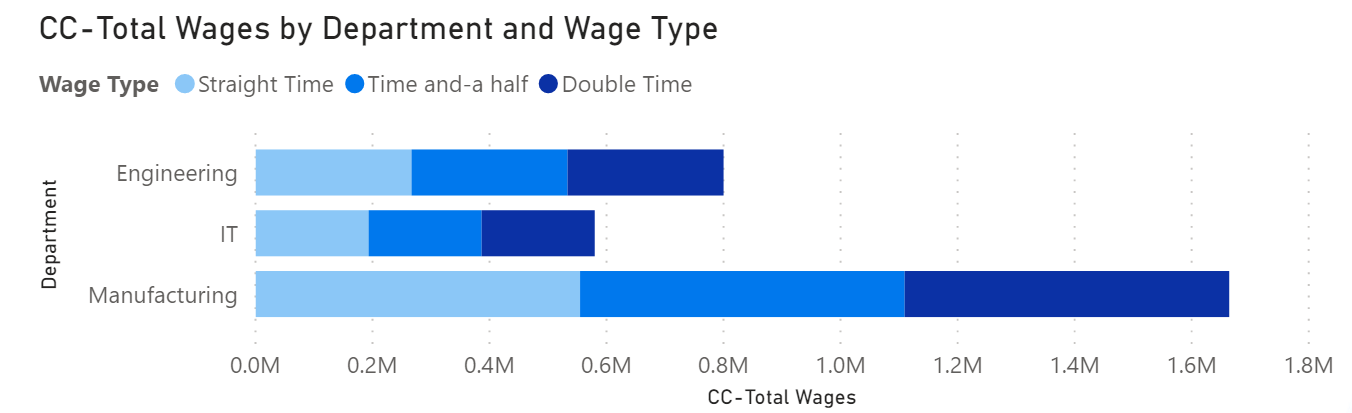
Now, lets make a simple bar chart of total wages by department, and use wage type as the legend (as an aside, when I have 3 categories to show in a chart, I tend to choose the darkest, lightest, and a medium colour for better contrast).
I followed the same basic pattern that I used for the calculated column solution, namely I calculated the component hours, and then use these to calculate the component wages, and then finally use simple sums to get the totals.
So, for regular hours, I copied the code from the [CC-Regular Hours] column of the [Time] table, but as I’m now not in the [Time] table, I can’t use the [Hours] column directly so I used SELECTEDVALUE; other than that, the formula is the same.
I then did things the same way for the [Overtime Hours] and [Holiday Hours] measures.
Again leveraging what I’d already done in the calculated columns solution, I copied the 3 wage calculations and changed the direct reference to the associated [Hours] column. Then I used the measures I just calculated. Also, I couldn’t use the RELATED function as I’m no longer editing the table directly, so I used the SELECTEDVALUE function instead to get the employee’s hourly wage.
M-Regular Wages =
VAR _Hours = [M-Regular Hours]
VAR _WageType = "Straight Time"
VAR _Rate = SELECTEDVALUE( Employees[Hourly Wage] )
VAR _Multiplier = LOOKUPVALUE( 'Wage Types'[Multiplier], 'Wage Types'[Wage Type], _WageType )
VAR _Result = _Hours * ( _Rate * _Multiplier )

RETURN
_Result
Once again, I can then do things the same way for the [Overtime Wages] and [Holiday Wages] measures.
So, as I did for the calculated columns solution, and now that I have the component hours and component wages measures, I made [Total Hours] and [Total Wages] measures, again using a simple sum and using the component “hours” and “wages” measures.
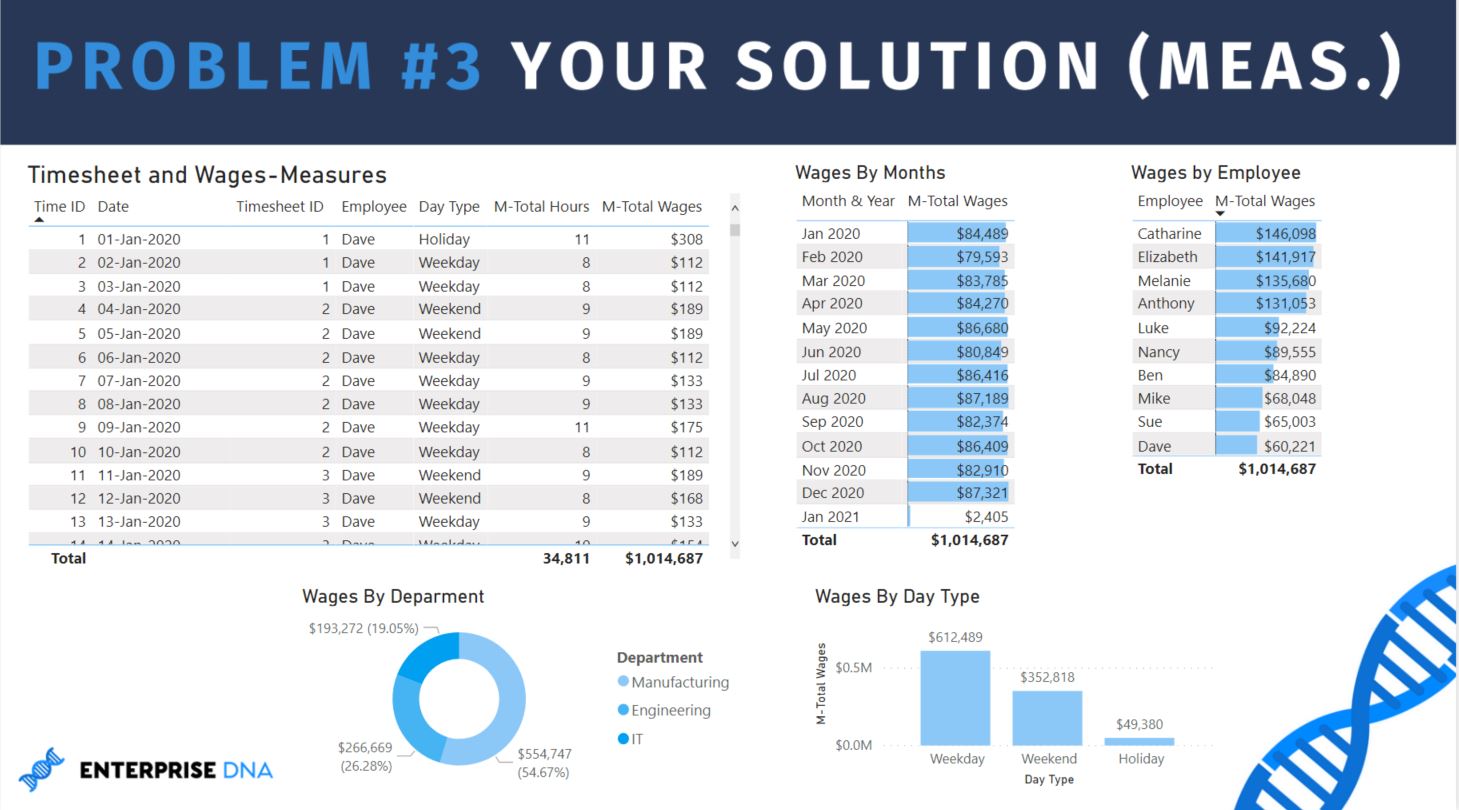
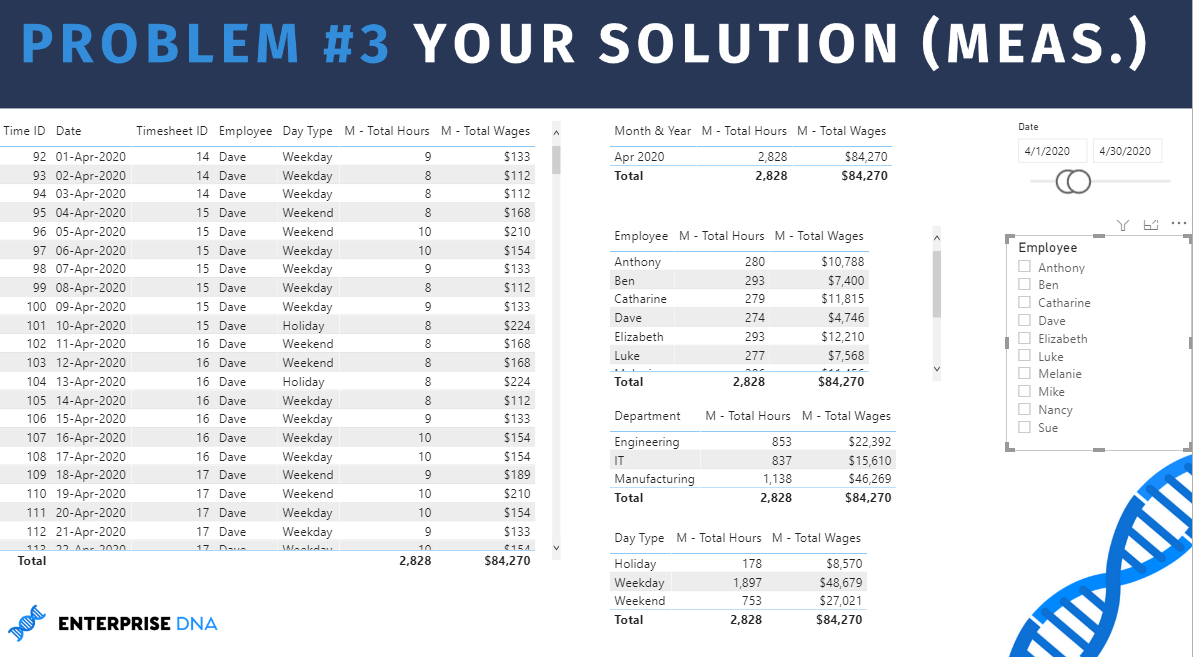
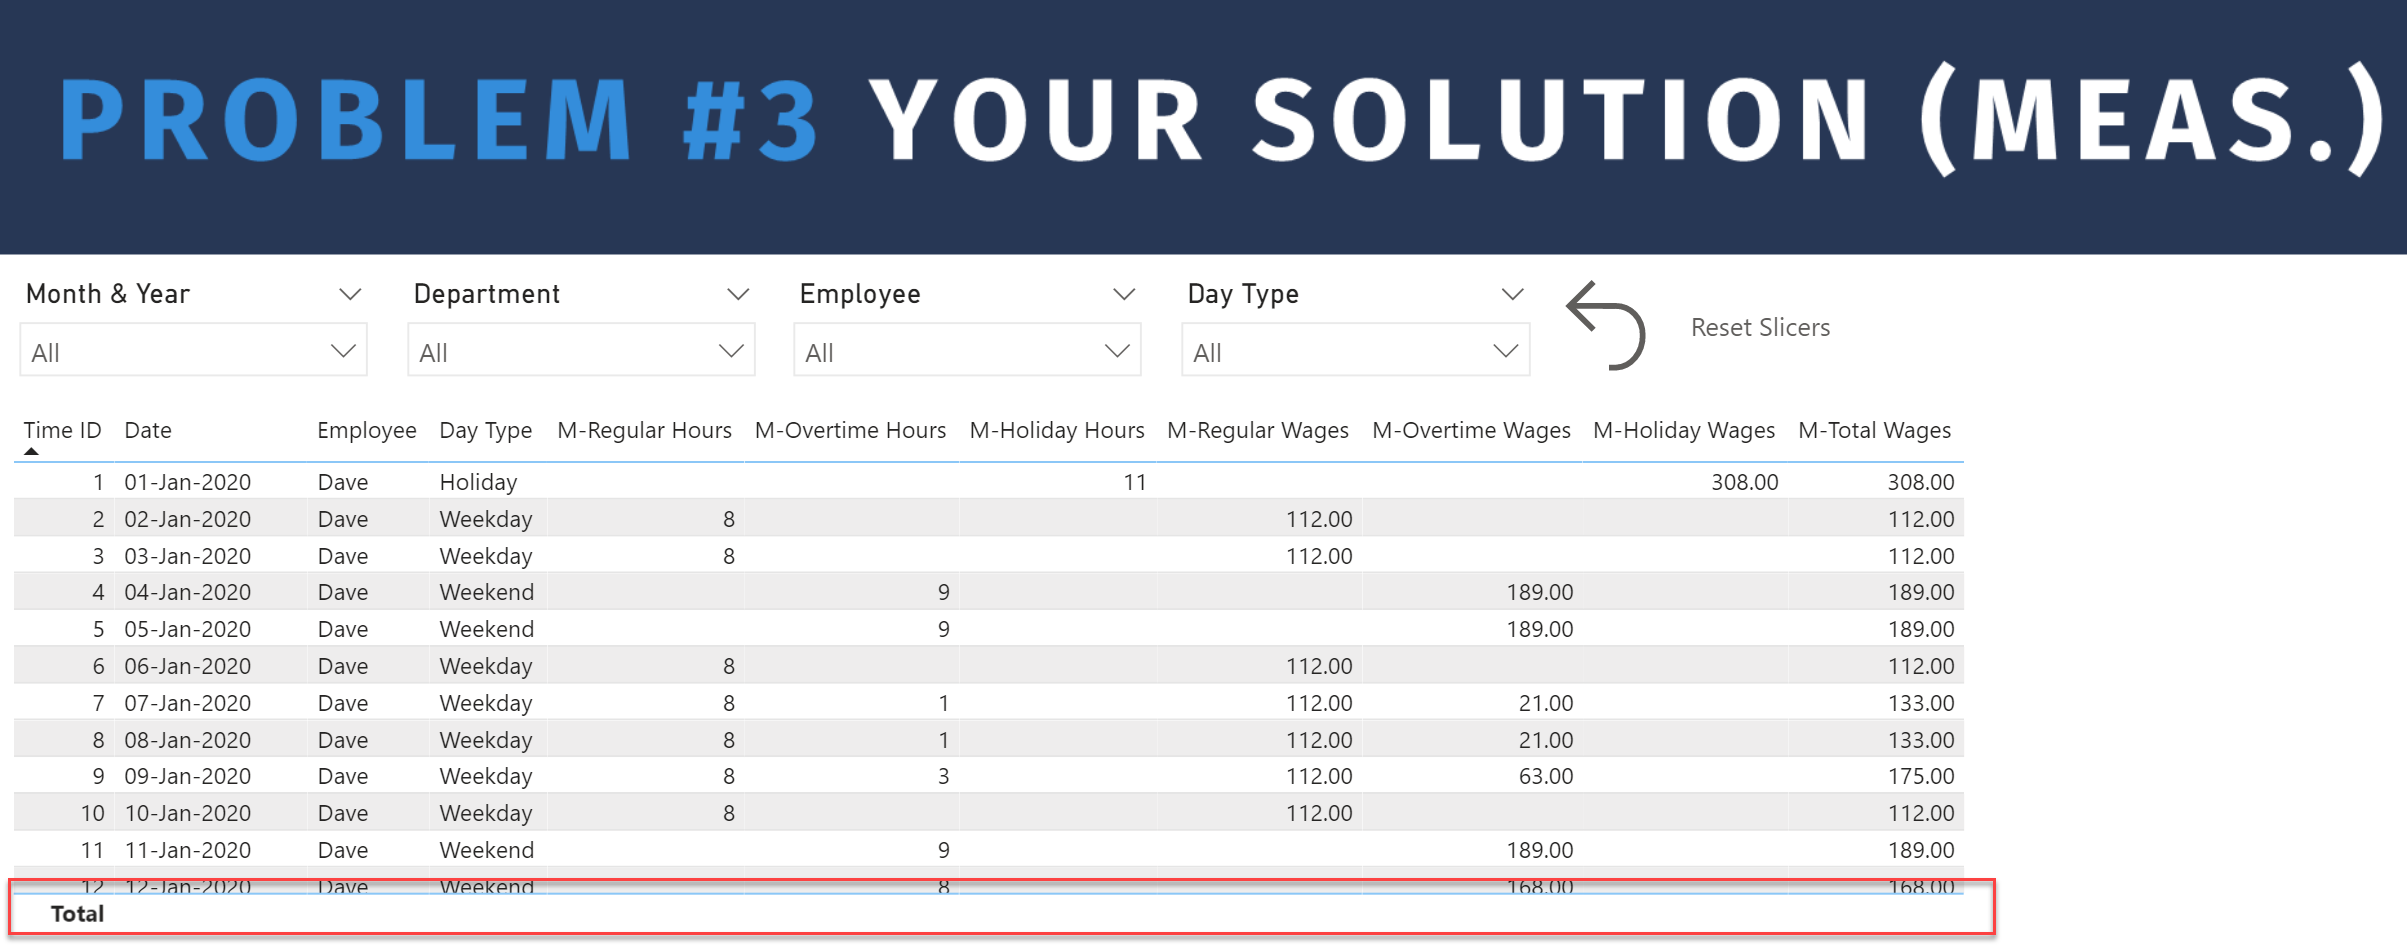
Then, I added these new measures into the table on the [Measures] page.
Add the [Regular], [Overtime], and [Holiday] hours measures
Add the [Regular], [Overtime], and [Holiday] wages measures
Add the [Total Hours] and [Total Wages] measures
Here we see a difference between the two solutions: with the calculated column solution, we implicitly got total values, whereas there are no totals for the measures solution.
This brings us to one of the most important “features” of Power BI visuals, in that one must pay particular attention to the totals when using measures. Virtual tables can be used in the DAX code of our measures to handle this situation. We can use the FIX INCORRECT TOTALS pattern post described on the Enterprise DNA forum.
So I created some new measures for the totals, and I prefixed these with “M2-”. So, for the [Total Hours], I first constructed a virtual table using SUMMARIZE to mimic the physical table in our visual. Then I used the SUMX iterator to sum over our virtual table.
M2-Total Hours =
// construct virtual table to mimic the physical table
VAR _vTable = SUMMARIZE( 'Time','Time'[Time ID],'Time'[Hours] )
// sum the virtual table
VAR _Result = SUMX( _vTable, 'Time'[Hours] )

RETURN
_Result
I then made a copy of our the first measures table, removed all the existing measure columns, and added the new [M2-Total Hours] measure; now we see the same row values but we have a total value this time.
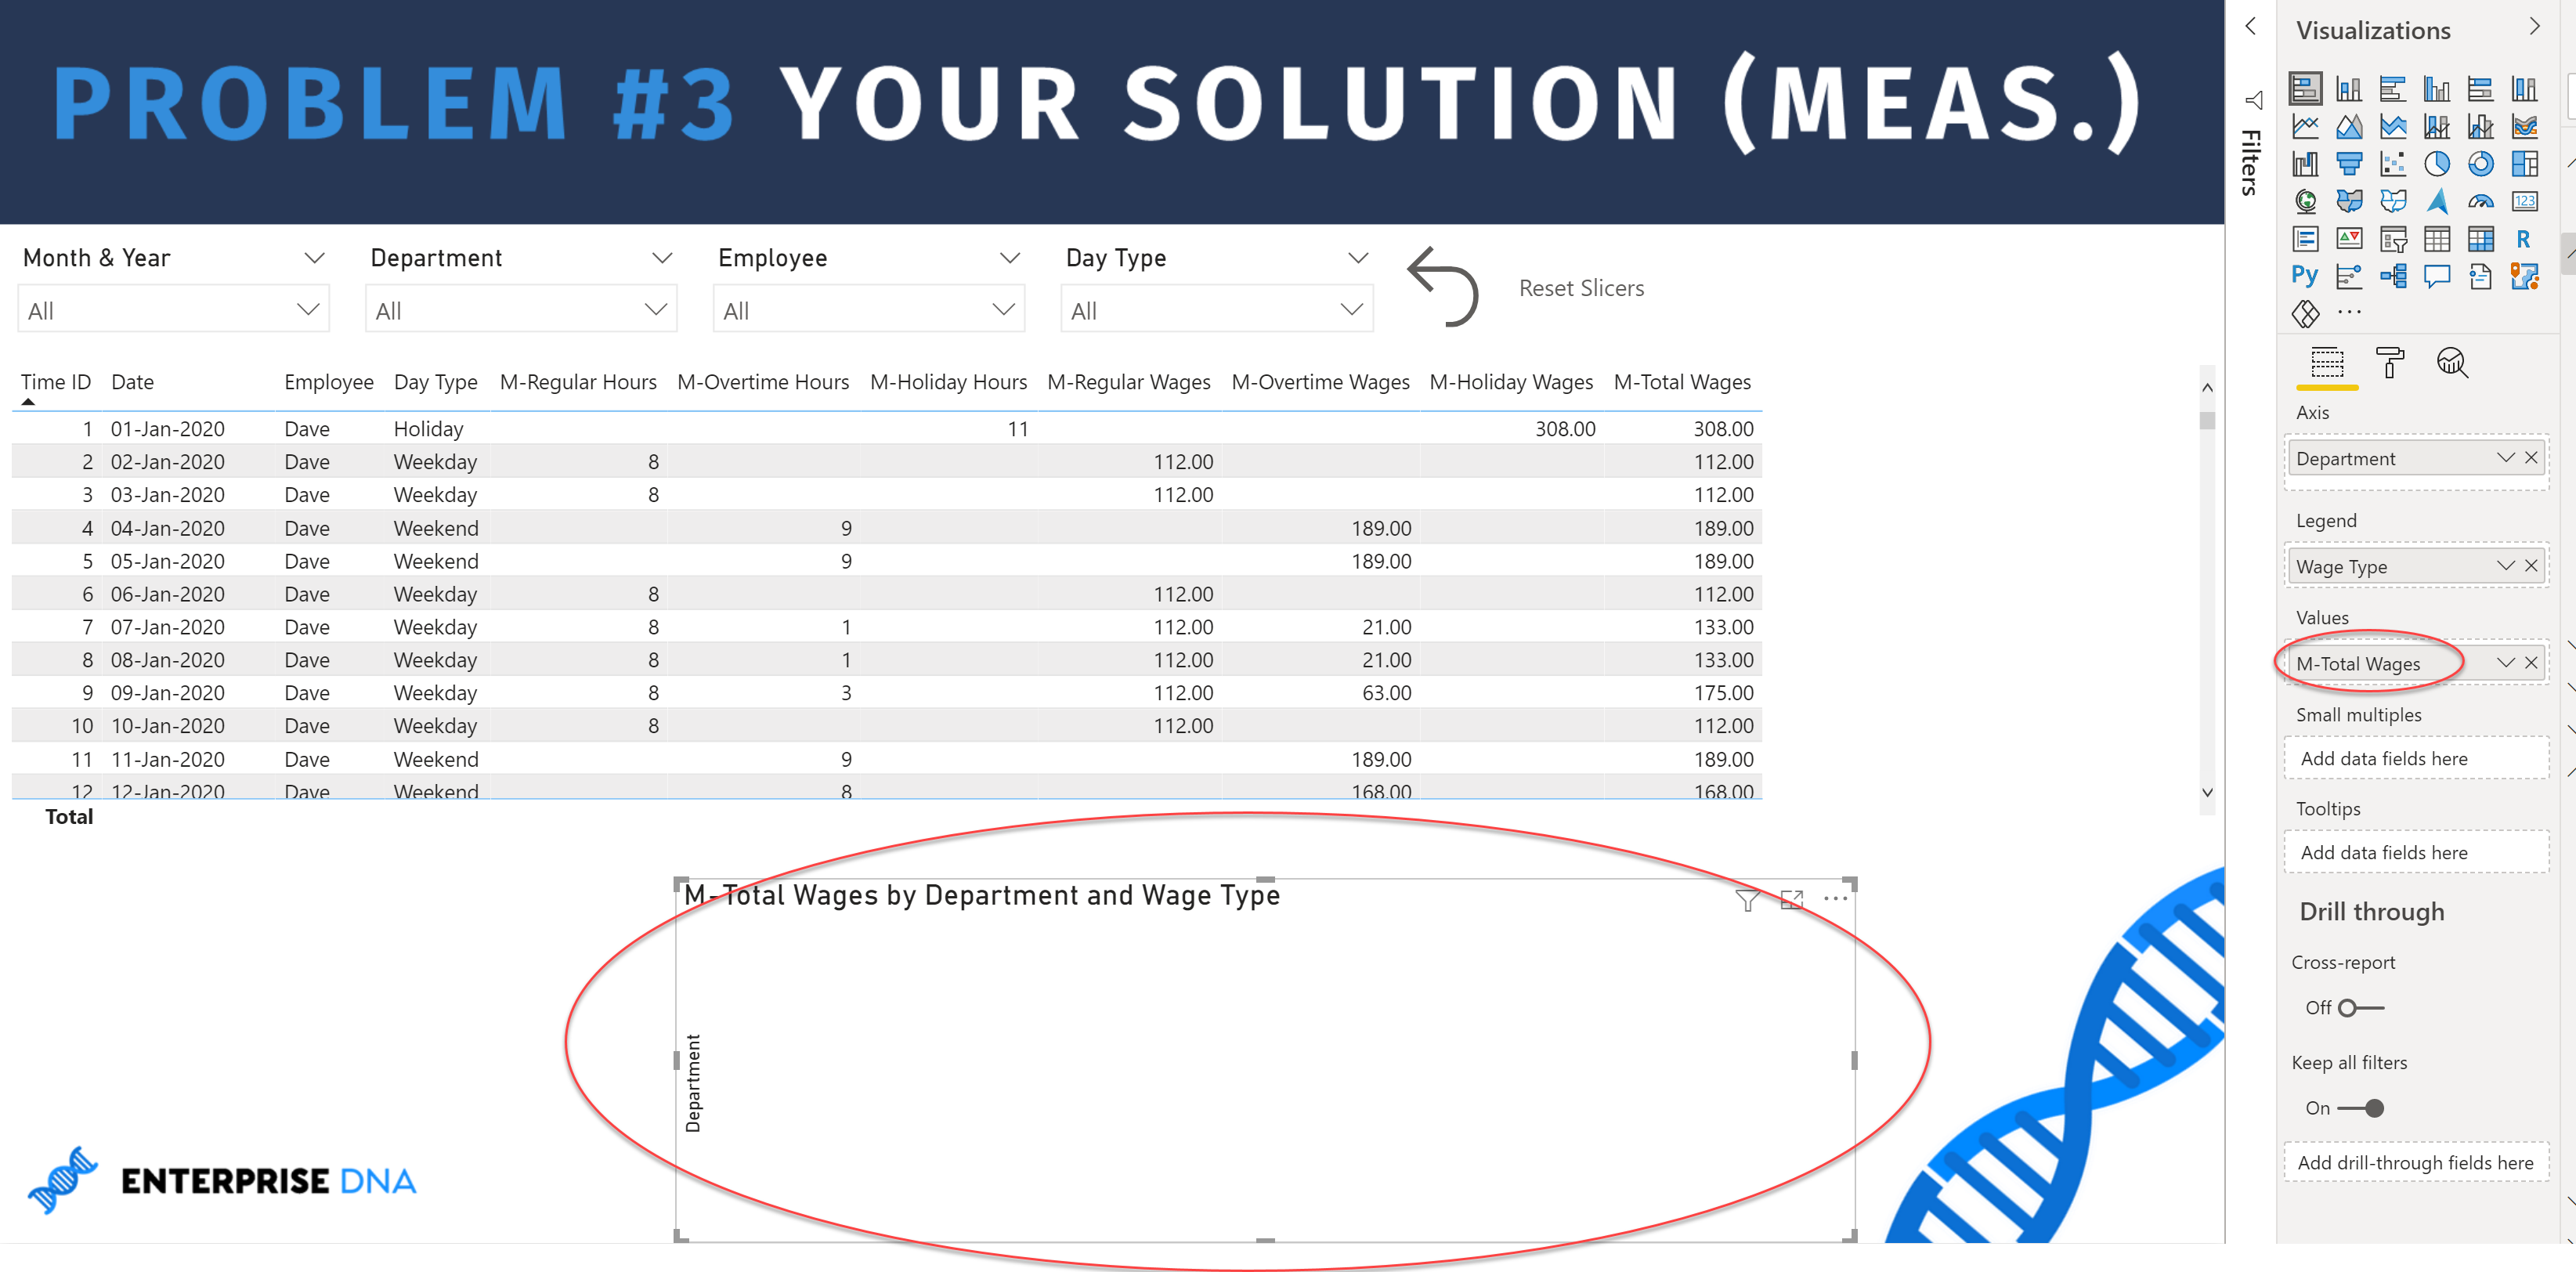
For the new [M2-Total Wages] measure, I used a slightly different technique, seeing as I already have the [M-Total Wages] measure for the individual rows, and I just need a virtual table to calculate the value for the total row. So, for this one, I used the SUMMARIZE method to create a virtual table, and then the ADDCOLUMNS method to add the existing [M-Total Wages] measure. Finally, I used the HASONEVALUE function to check if its an individual row, and if so, just used the existing [M-Total Wages] measure; if it’s not an individual row (i.e., it’s the total row), then I again use the SUMX iterator function to sum over my virtual table.
M2-Total Wages =
// construct virtual table to mimic the physical table
VAR _vTable = ADDCOLUMNS(
    SUMMARIZE( 'Time',
        'Time'[Time ID], Dates[Date], 'Time'[Timesheet ID], Employees[Employee], 'Time'[Hours], Employees[Hourly Wage] ),
        "@TotalWages", [M-Total Wages]
    )
// if single row, return existing measure; it total row, sum virtual table
VAR _Result = IF(
    HASONEVALUE( 'Time'[Time ID] ), [M-Total Wages],
    SUMX( _vTable, [@TotalWages] )
)

RETURN
_Result
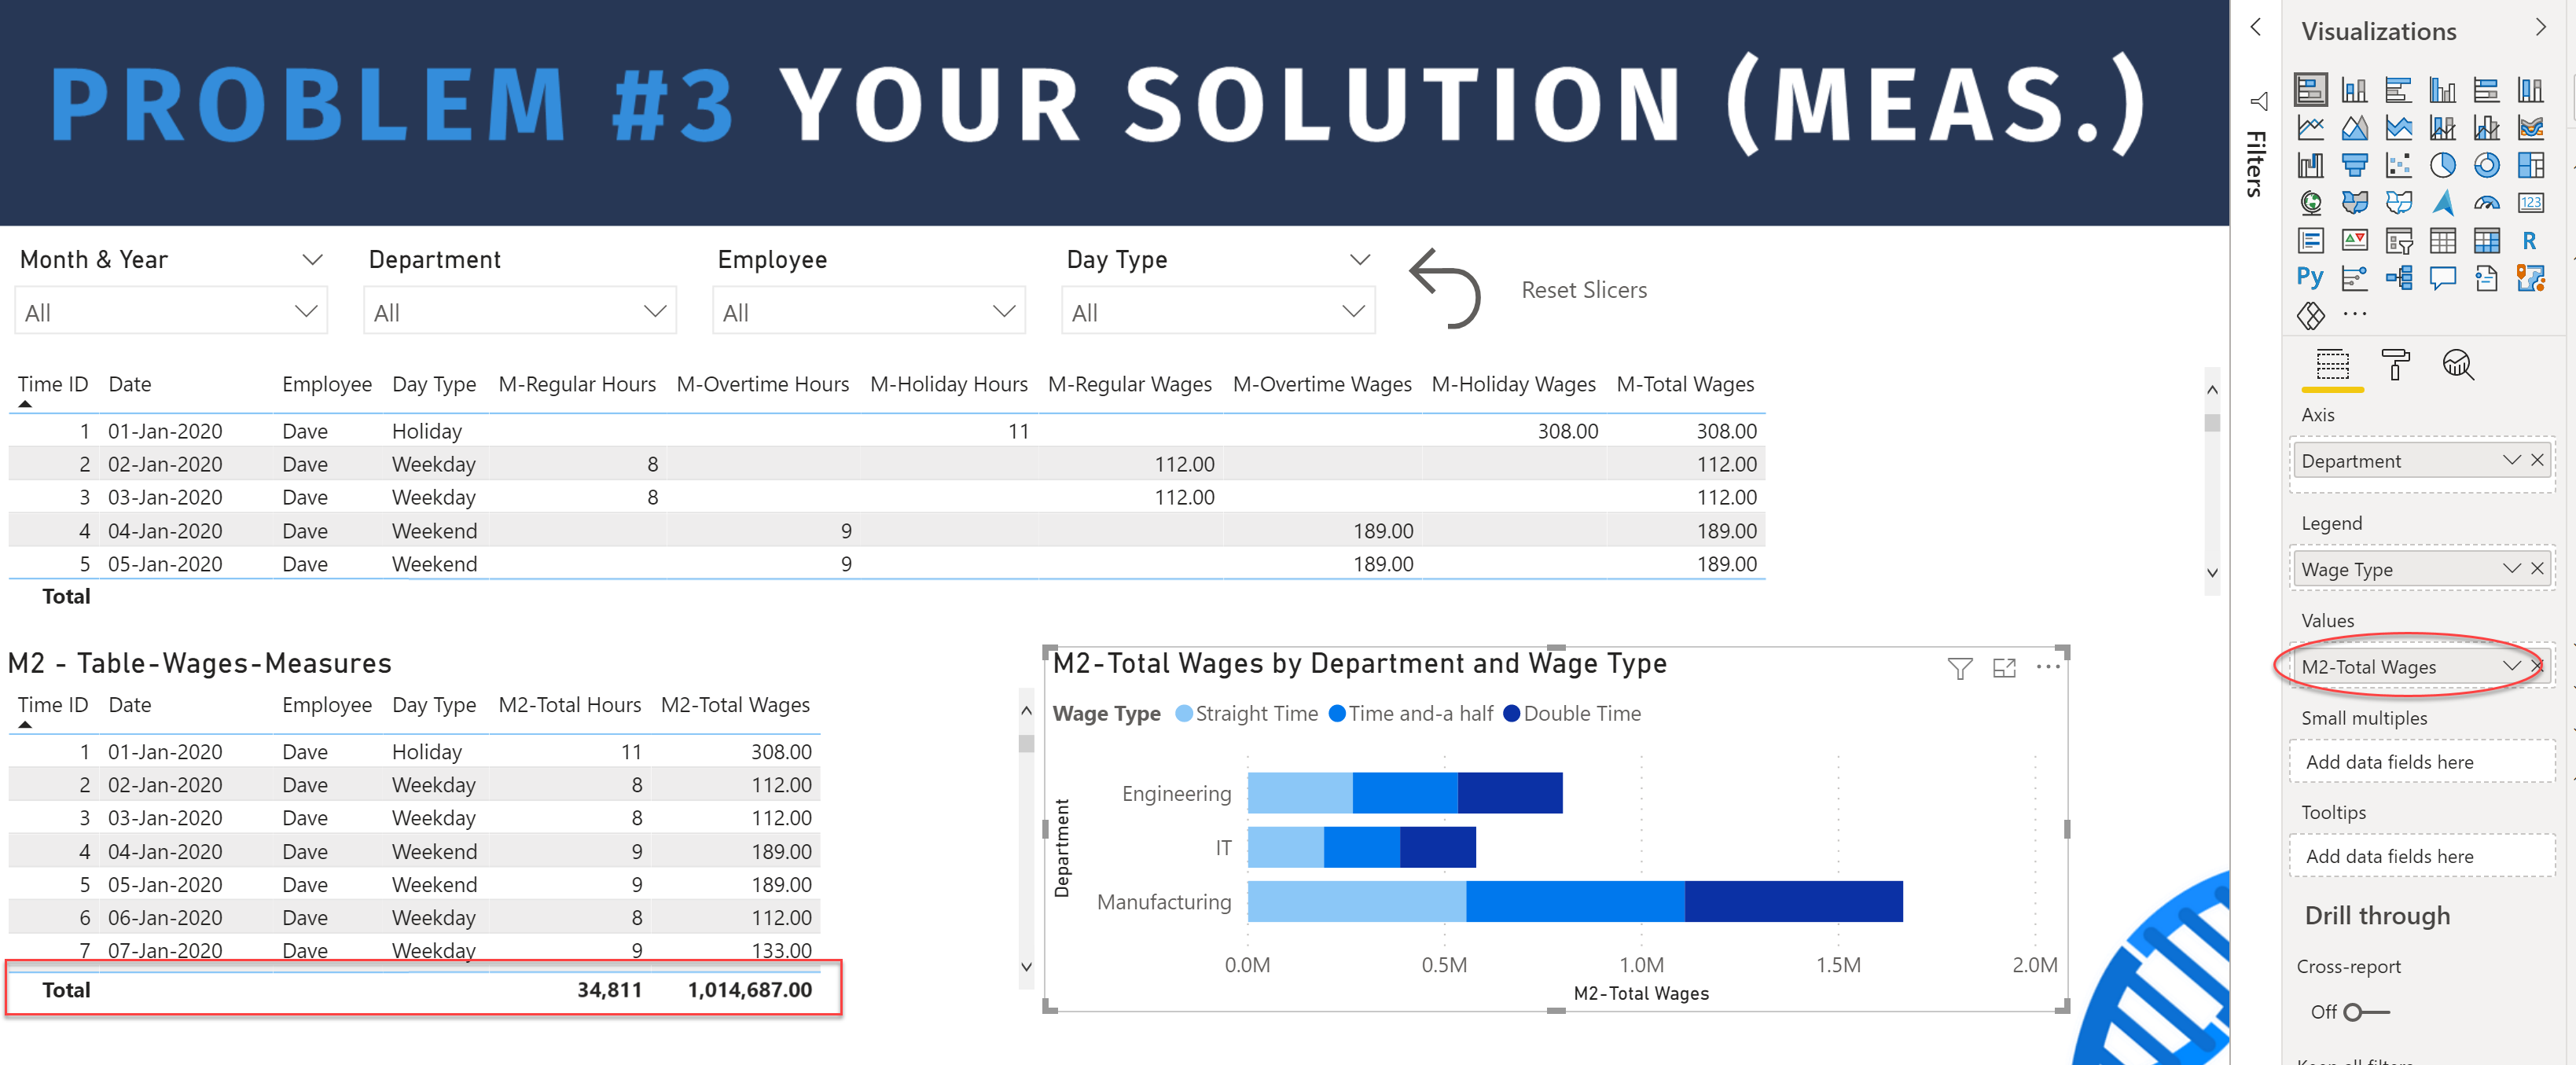
And you can see that when I add this new measure to my second measure table, the totals display, and now, when I make a simple bar chart of total wages by department, the chart shows correctly.
Discussion on the benefits and limitations of Measures vs. Calculated Columns
So, to summarize what I found:
Measures:
Pros:
Best practice
Measures are NOT calculated when the data model is refreshed, but rather only when actually used in a visual
Cons:
May require extra DAX code working on a virtual table representation of the visual to properly calculate totals
Calculated Columns:
Pros:
Easier to learn, and is a familiar starting place for those coming from Excel
Cons:
Each CC is physically created in the data model and increases the size of the data model and decreases the performance of the report.
For me, I prefer measures and tend to use calculated columns only when I can’t do something easily in measures; measures are my first try for everything (although I do have an exception to this personal rule, and you may have seen it in some of my Enterprise DNA challenge submissions, where I use a calculated column to create a small number of categories when there are many individual dimension values).
And thus concludes another very successful round of Problem of the Week. Huge thanks to all who participated, and also to @Greg, who did a terrific job developing and leading this week’s problem.
We hope you’re finding these both entertaining and instructive. I had an interesting experience this morning of being able to solve a member’s problem using a trick I learned in POTW #3, so I’m definitely finding that participating in these is upping my own skill level.
Final order of business – here are the winners of the drawing for the laptop stickers for this round. Winners – if you haven’t already, please send me your physical mailing address at brian.julius@enterprisedna.co.
Better late than never ! The task wasn’t that easy but I made it.
A calculated column is an extension of a table that’s evaluated for each row. Calculated columns live in the xVelocity in-memory storage of Power BI, just like all the other data you import from a data source. A calculated column is virtually the same as a non-calculated column, with one exception. Their values are calculated using DAX formulas and values from other columns.
A calculated measure is not treated the same as any other table column. Unlike a calculated column, measures are evaluated on the fly with every change in context. If you change a date filter from 2019 to 2020, all the measures will be calculated again. While this is nice for seeing context-based calculations in real-time, it becomes demanding on your computer’s processor. Find attached my solution.
The result video and your(the) explanation behind the project on time sheets was beyond excellent. Even with those great examples I have a few questions.
I am trying to generally replicate both the calculated columns and measure solution for two fields.
“Current Period Balance Hours” and “Paid”. The excel formula is kind of complicated but I believe that has been almost replicated in Power BI. But I definitely need some help.
I am fairly close but am struggling to integrate the prior month ending balance of ours to be paid when the logic calls for it.
I am attaching my PBIX file and an excel file that highlights the results (in yellow) I would like to obtain.
My .PayCalc.xlsx (136.5 KB) PayCalcs.pbix (115.3 KB) pbix file only has three employee ID’s whereas you’ll notice my excel file has more than three. I highlighted in green the three I’m trying to get figured out for this exercise.
Any input on this is sincerely appreciated. Thank you for your time in advance.
Thanks @Whitewater100 for your kind words … first time lucky. Apologies but I’m a bit under-the-gun at the moment and likely won’t be able to take a look at your issue for a few days; sorry. If your need is more immediate, perhaps create a new topic with your issue and PBIX for the forum members to pursue in the meantime.
Greg
Hi Greg:
Thanks for writing back. My need is not super urgent but am very interested in the answer! I appreciate if you can check it out ( very much appreciated) and I will put on the general forum if I can figure that out, which is probably easy to do.