Problem of the Week #11 - Project Balance

Hi Everyone. Here’s the 11th installment of the Problem of the Week, but this time we’re going to do things a little differently: instead of giving you a DAX or Power Query issue and a starting-point PBIX, this is more of a general Power BI Desktop design and development challenge. We’ll pose a question, provide a small set of sample data, and see what can be developed from scratch.

(For background on the POTW initiative, check out this post .)

Background
A not-uncommon problem that almost everyone experiences is that a project expands in scope over time, and when one side of the PROJECT MANAGEMENT TRIANGLE changes, at least one of the other sides change as well (e.g., if you increase the scope [increase the hours required to complete the project], the only way to keep the time and cost unchanged is to reduce quality, which is rarely an acceptable answer and one that we will not be considering further here.)


So, for the purposes of this example, we will assume that project quality remains fixed, so therefore any increase in scope (which is denoted by an increase in the hours required to complete the project) will necessitate an increase in time or cost (or both).

The Data
For this problem, two CSV data files have been prepared, for projects and holidays.
Projects.csv (393 Bytes)
Holidays.csv (633 Bytes)

As well, the Enterprise DNA Extended Date Table (Power Query M function) should be used.

The Business Constraints
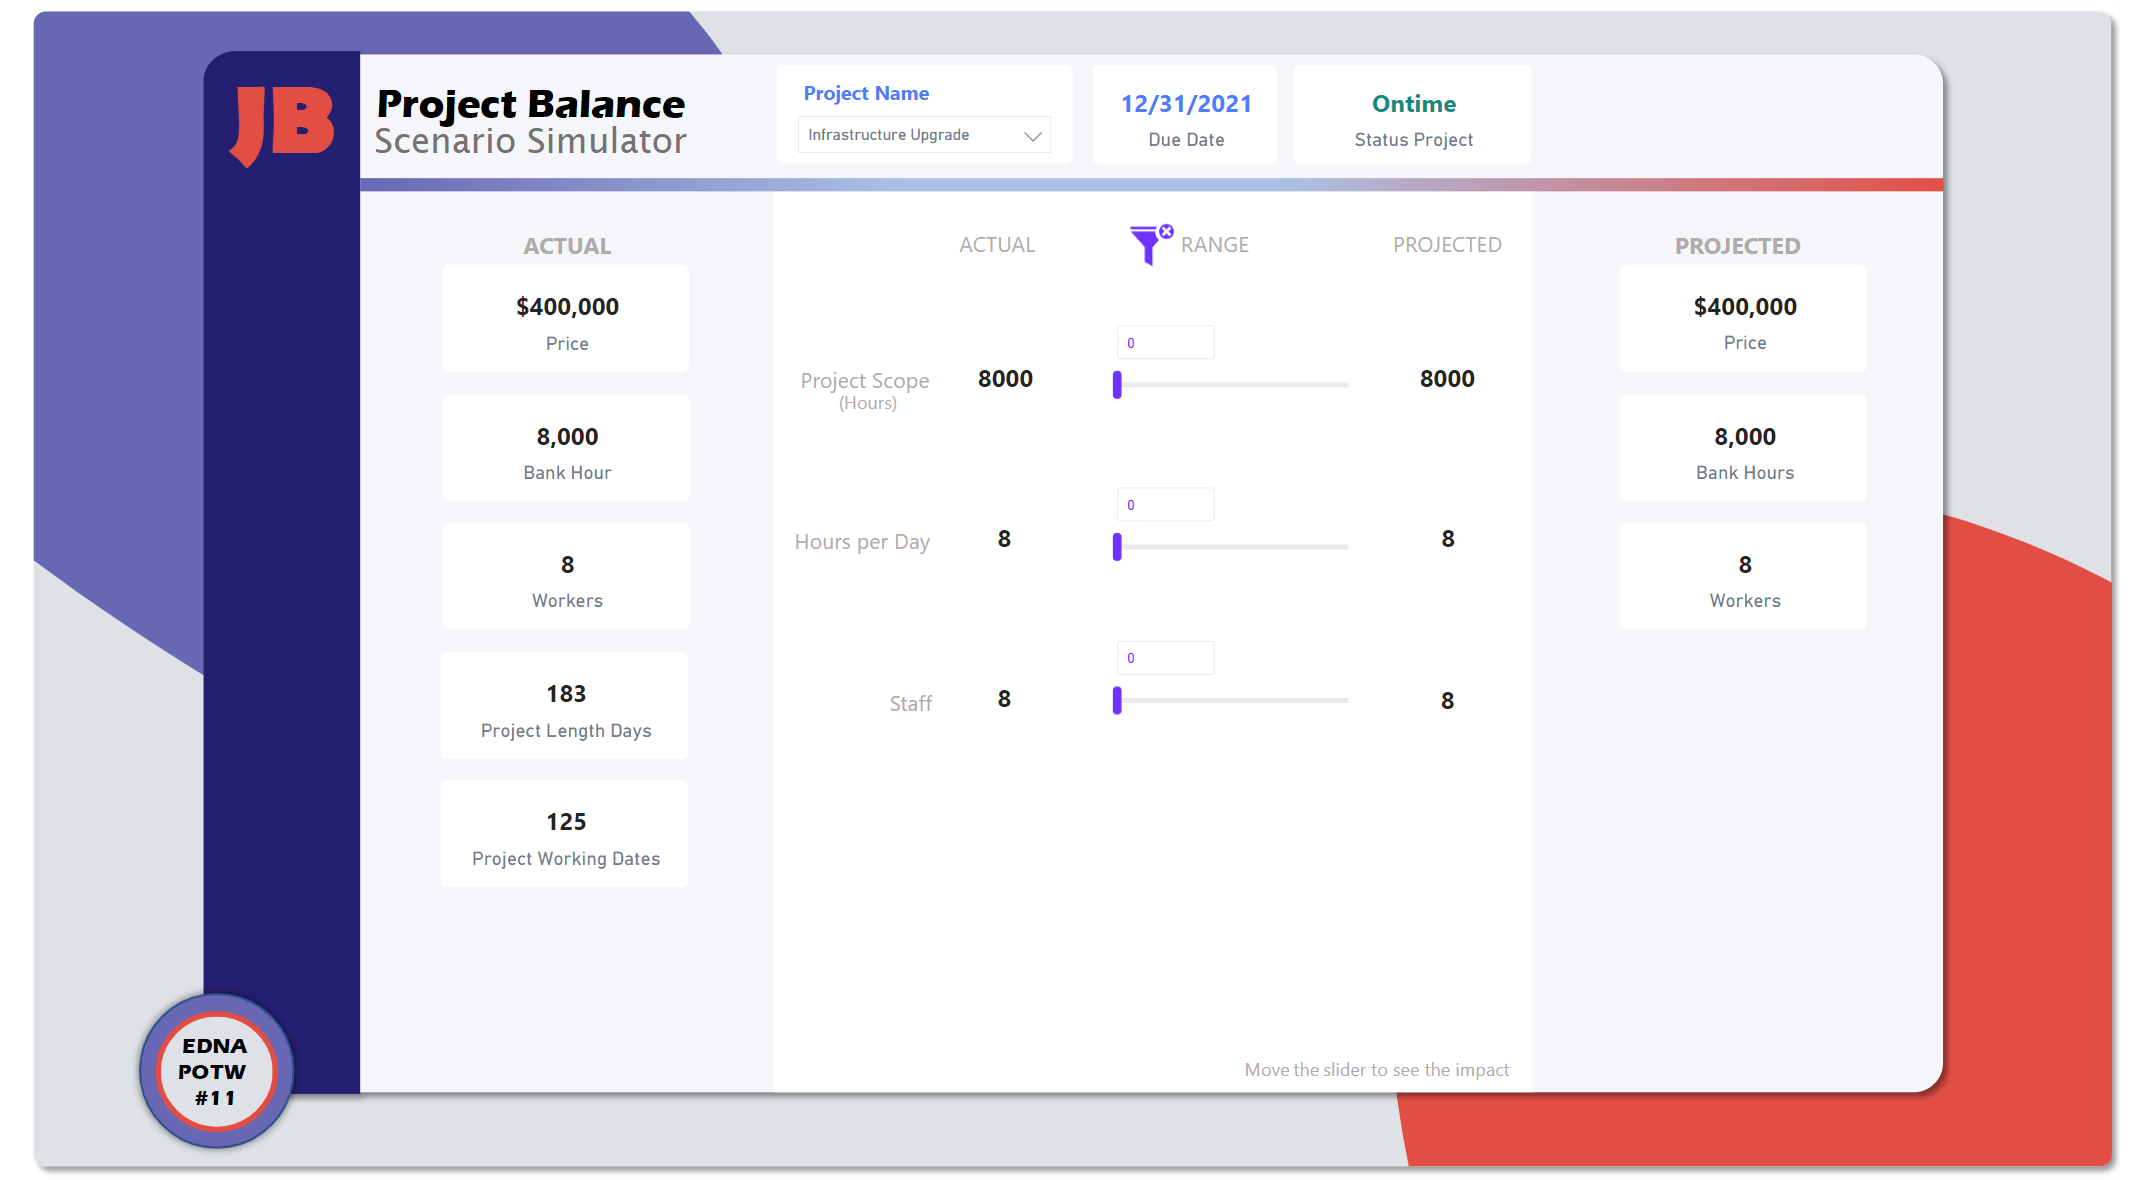
You have multiple projects, and every project has a promised due date, and a penalty fee will be applied if the project is delivered late. For this problem, we are only concerned with the “Infrastructure Upgrade” project.

All existing staff have a wage rate of $50/hour (salary plus company overhead), and work a regular 8-hour workday on each business day.

Work can only be conducted on business days (i.e., not on weekends, not on holidays).

You can add staff to try to finish a project on time, but there is a sunk cost of one week’s service before the new staff member can contribute to a project (so $50/hour * 40 hours = $2,000).

You can add overtime for existing staff to try to finish a project on time, and staff can work up to 12 hours per day, again on business days only.

The Solution Constraints
Your solution should:

  • Be configurable to allow the user to connect to the data from any folder, and let the user enter the source folder from the user interface (i.e., without modifying the code in Power Query); the solution should handle cases where the user may or may not include a backslash at the end of a folder name
  • Provide the answer for a user-selectable project scope increase, in 5% steps from 5% to 100%
  • Provide the answer for all project scope increase percentages, in 5% steps from 5% to 100%
  • Load the minimum amount of data

The Question
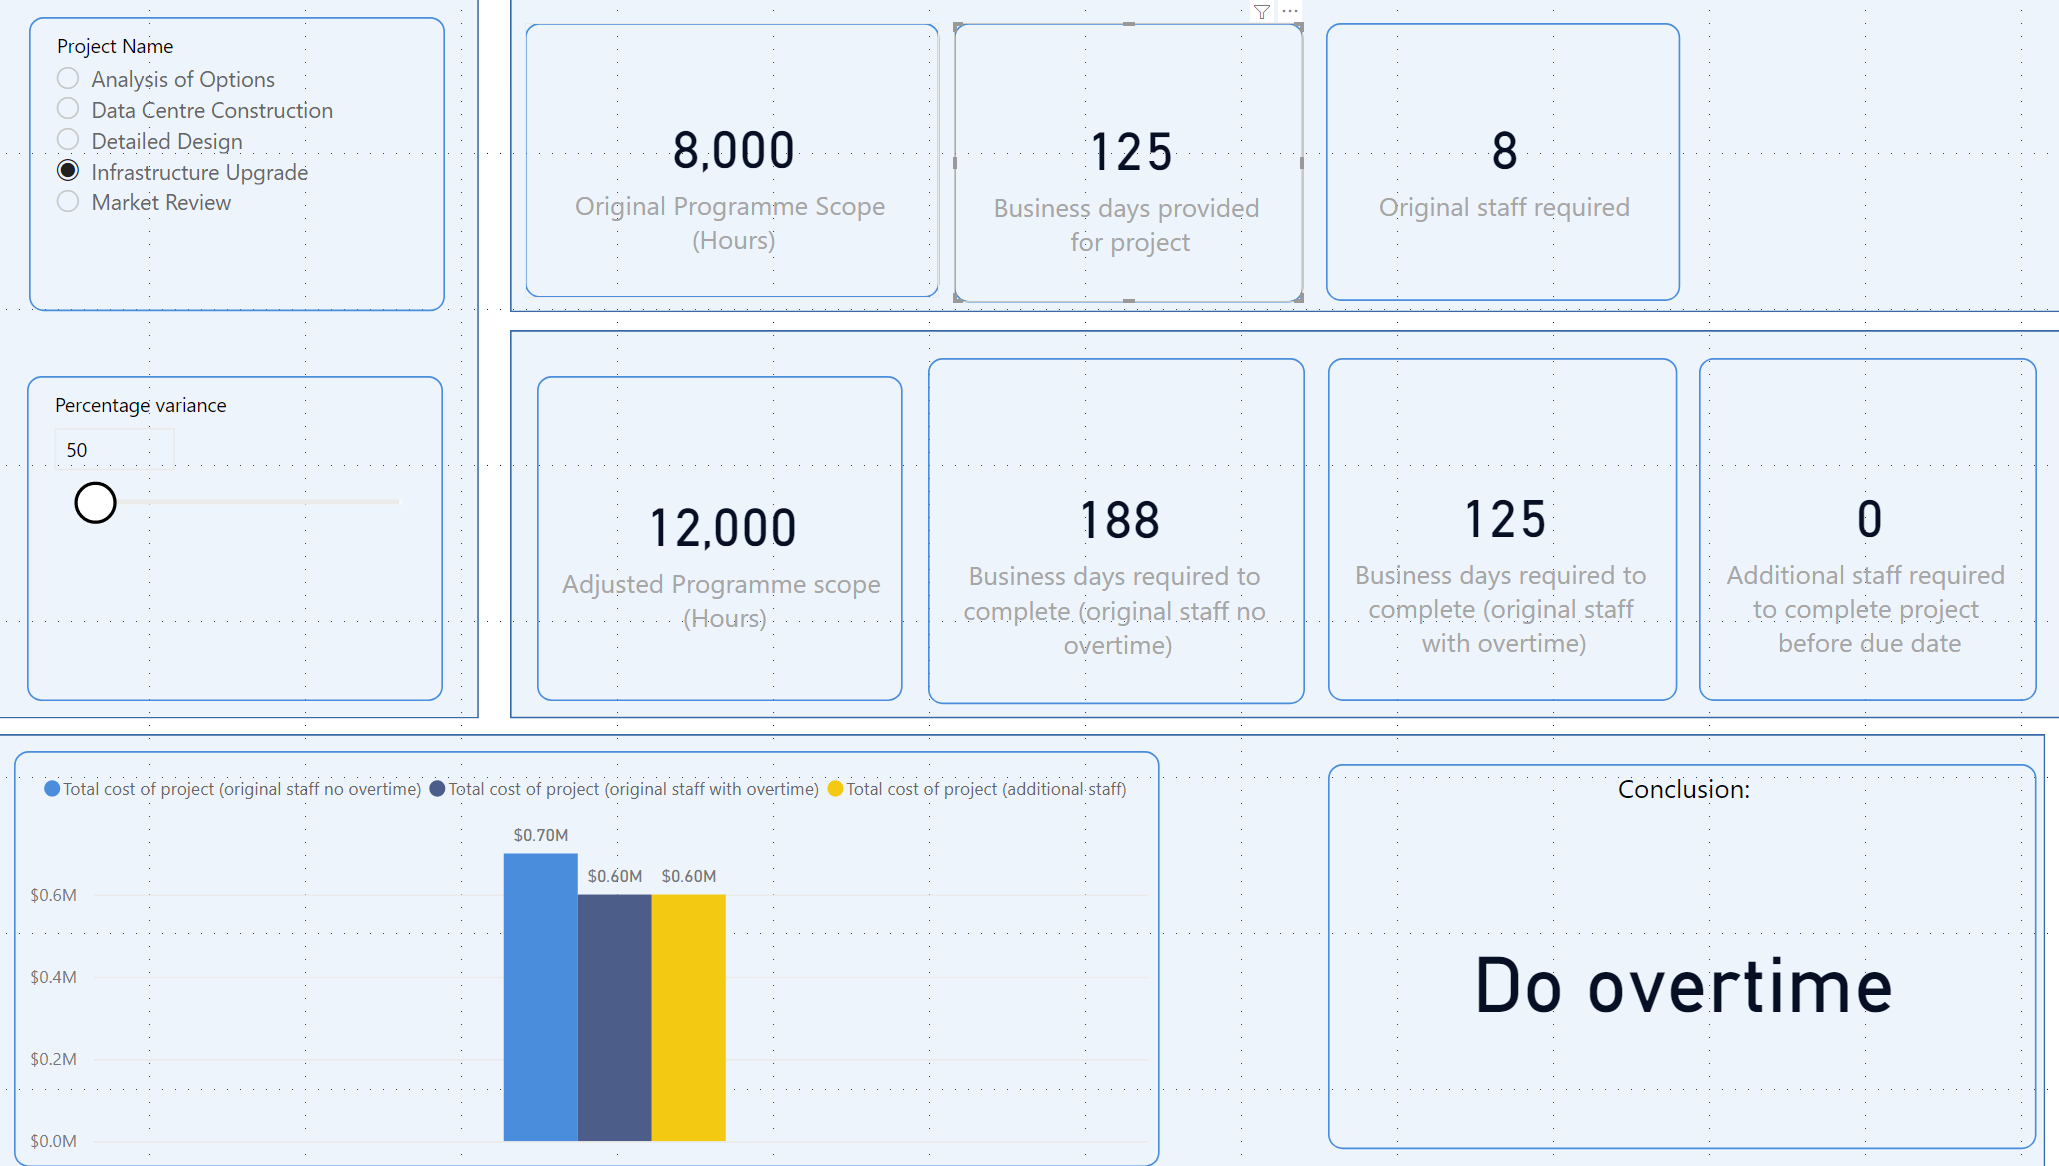
So, the problem is how do you handle project scope increases? You have three options:

  1. Do nothing (pay late penalty fee, no new staff, no overtime)
  2. Add staff (no overtime, no late penalty fee)
  3. Add overtime (no new staff, no late penalty fee)

For each percentage increase in the project scope from 5% to 100%, which option is preferred?

Your Task
Your task will be to use many aspects of Power BI, including both DAX and Power Query, and a four-pillars approach to provide an answer for the question that is consistent with the teachings on Enterprise DNA; try to provide a the best laid-out and organized solution that you can. We will not be providing a starting-point PBIX, rather it’s up to you to create a new Power BI file from scratch. Along with your PBIX, submit a brief statement of the observations from your 5%-100% “Scenarios” table.
As a final note, strive to implement the Enterprise DNA approach as quickly as possible for you on this problem, and note what tasks remain for you at the 2-hour mark. (One of the takeaways for this Problem of the Week is to identify areas in which you’re quite comfortable as well as those that are candidates for further learning.) This is not a competition, but rather a chance for you to evaluate your learning to date.

Posting Your Solution
We ask that if you post anything directly related to a solution to please use the “Hide Details” or “Blur Spoiler” options within your post. This will prevent people who have not yet completed their solution from seeing things they might not want to see yet and could influence their solution.

To use these options, just select the text or image you want to hide, click on the gear icon on the top right at the top of your post and select either Hide Details or Blur Spoiler.

image

EDNA Problem Solver Stickers
Everyone who successfully completes a Problem of the Week will receive one of these cool Enterprise DNA vinyl laptop stickers:

image

To receive your sticker, when you submit your solution, just send a copy of your physical mailing address to problemoftheweek@enterprisedna.co.

Deadline and Eligibility
If you want to submit your entry before the solution becomes public, please do so before 9am ET Wednesday May 12, 2021. Reminder that Problem of the Week is open to everyone – members and non-members. Members should just post your solution directly to this thread in the forum. Non-members, you can send your solution to us at the email address above and we will post it to the forum thread for you.

We hope you find this initiative fun, challenging and helpful in continuing to build your Power BI skills. All of the information you will need is contained in the files within this post. If you have any questions or comments, just message me at @Greg in this forum thread or at the email address above.

Good luck, and enjoy!!!

Greg

P.S.: Your feedback is always welcome, and if you have a real-world problem that you think might make a good future Problem of the Week, please email it to us at problemoftheweek@enterprisedna.co. Thanks!

2 Likes

This has been a rather unusual problem of the week - that feels rather more like one of the challenges than a simple problem.

Summary

The approach I took was to create a dashboard page that enabled the user to select the project that they are interested in and the Percentage variance to the original project scope. The dashboard would then calculate how much time (in man-hours) the adjusted project would take and the amount of days required for the original number of staff to complete the project, without overtime and with overtime, and the number of additional staff that the project would need to take on to complete the project in time. For this, I needed to assume that the project with its original scope has been staffed to just complete the project in time without requiring overtime.

The dashboard then shows the relative cost of delivering the project under each option - and presents the conclusion - ie which is the lowest cost option for the company to follow (Do overtime, Add staff to the project, or Do nothing and pay the penalty).

I needed to extend the Percentage Variance parameter line for increased project scope out to 1000% or else I didn’t reach the crossover point between adding staff and paying the penalty.

POTW #11 - Project balance.pbix (197.5 KB)

I’m not sure that I really answered the question as set, and I’m sure that I could tidy up my highly branched measures - but this was done more or less within the two hour window suggested and was an interesting mash-up of DAX and dashboarding.

I’ll be interested to see what the official solution is - and therefore what I should have been doing.

Chris

Good evening,

Hereby a solution from my site, looking forward for (technical) comments.
“Overdued” the 2 hours mark . .

Summary

I have added a page with a rather detailed explanation of the 3 scenarios,
the reporting page should be self-explanatory .

Problem of the week 11 Project Infra scenarios v5.pbix (239.9 KB)

As it is unknown to me, and I did not find explanations yet, an user input is missing in my solution.

Kind regards,

Hi @Greg

This is my solution for POTW#11, I took a twist and a made a Scenario Simulator. :grinning:

Summary

Online Version

POTW11 - Project Balance - jbressan.pbix (377.0 KB)

1 Like

Hi Everyone.

So as noted in the original POTW 11 post, this problem was more of an exercise in general Power BI Desktop design and development. The goal was to use many different techniques, be they DAX, or PQ, or UI/UX as necessary, and some of the items I was looking for included:

  • Load text data, remove blank rows, promote first rows as headers
  • Choose columns on the PROJECTS table to not load the [Project Key] column
  • Create Parameter to hold the Source Folder
  • Modify the M code for the loaded PROJECTS and HOLIDAYS text files to use the Source Folder parameter (that may or may not end with a backslash)
  • Use the Enterprise DNA Extended Date Table with holidays
  • Choose columns on the [Dates] table to only load the [Date] and [Is Business Day] columns
  • Mark the [Dates] table as a date table
  • Create groups to organize all queries
  • Create a measures table to organize all measures
  • Create a waterfall layout to model dimensions and fact tables, with measure groups to the right and supporting tables below
  • Create a What-If Parameter to hold the scope % change
  • Use the Edit Interactions function to prevent changes to the 5%-100% “Scenarios” table visual when selections are made in the “Scope % Change” What-If Parameter
  • Select only a single project via filtering in Power Query, filtering in the Data View, or filtering via the FILTER pane

Here’s the notes I kept during development; they’re mostly in the order I performed tasks, which is why there are multiples for some areas (e.g., Data Visualizations, etc.):

Data Loading:

  • loaded CSV for [Projects]
    • removed top 1 row
    • promoted first row as headers
    • used Power Query filtering to keep only “Infrastructure Upgrade” project
    • used Power Query “Choose Columns” to remove [Project Key] column
  • loaded [Holidays]
    • removed top 4 rows
    • promoted first row as headers
  • created blank query, loaded Extended Dates Table for 2021 using [Holidays] / [Date]
    • renamed [Query1] to [fxDatesQuery]
    • renamed [Invoked Function] to [Dates]
    • used Power Query “Choose Columns” to keep only [Date], [DayOfWeekName], [IsWorkingDay], [IsHoliday], and [IsBusinessDay] columns
  • moved [Dates] and [Projects] table to new [Data Model] group
  • moved [Holidays] table to new [Supporting Tables] group
  • moved [fxDatesQuery] to new [Parameters and Functions] group
  • used “Table Tools \ Mark as date table” to mark [Dates] as a date table
  • used “Enter Data” to create [Key Measures] table
  • used “Transform Data \ Manage Parameters \ New Parameter” to add parameter for [SourceFolder] (no space or underscore) and set value to “C:\Temp\POTW 11”
  • used “Transform Data \ Advanced Editor” for both [Projects] and [Holidays] tables to add “Source_Folder” line (complete with “End\1” check for "") and alter “Source” to use “Source_Folder”
  • edited parameter to “C:\Temp\POTW 11 a”; see refresh doesn’t work
  • closed all programs, then used File Explorer to rename folder from “C:\Temp\POTW 11” to “C:\Temp\POTW 11 a”; see refresh again works
  • edited parameter and added "" to end; see refresh still works
  • created a What-If Parameter to hold the “Scope % Change” (whole number, minimum = 0.05, maximum = 1, increment = 0.05, add slicer to page)
    • in slicer, turned RESPONSIVE to OFF in FORMAT \ GENERAL to use small bar slider instead of big circle slider
    • used [Data View] to change data type to “percentage”
    • edited the GENERATESERIES code to use CURRENCY() around values; this causes the 100% value to be included

Data Modelling:

  • moved [Dates] (a lookup table) to top row
  • moved [Projects] (a fact table) to middle
  • moved [Key Measures] (a measures table) to top-right
  • moved [Holidays] (a supporting table) to bottom-left
  • created 1-to-Many relationship from Dates[Date] → Projects[Start Date]; (NOTE: Power BI created the relationship as 1:1\Both, so needed to alter it to be 1:*\Single)

Data Visualization:

  • add “Project” table and added [Project Name], [Start Date], and [Due Date] columns from [Projects] table

Data Loading:

  • used [Data View] to change format of [Start Date] and [Due Date] columns of [Projects] table to “dd-mmm-yyyy”

DAX Calculations:

  • added 4 “Base” measures [Base Cost], [Base Hours], [Base Days], [Base Staff]; added all to “Project” table
    • in [Base Days] measure, take into account that work can only be done on business days

Base Cost = MAX( Projects[Price] )

Base Hours = SUM( Projects[Hours] )

Base Days = 
CALCULATE( COUNTROWS( Dates ),
    FILTER( Dates,
        Dates[Date] >= MAX( Projects[Start Date] ) &&
        Dates[Date] <= MAX( Projects[Due Date] ) &&
        Dates[IsBusinessDay] = TRUE() )
)

Base Staff = DIVIDE( [Base Hours], [Base Days], 0 )

  • added [Scenario Hours] measure (use simple measure branching of base hours and scope % change); added to “Project” table

Scenario Hours = [Base Hours] * (1 + [Scope % Change Value] )


  • added [Incremental Hours] measure (use simple measure branching)

Incremental Hours = [Scenario Hours] - [Base Hours]


  • added [Late Penalty Cost] measure; added to “Project” table

Late Penalty Cost = MAX( Projects[Late Penalty Fee] )


  • added [Add Staff Cost] and [Add Overtime Cost] measures
    • use ROUNDUP to ensure no “partial” persons are returned
    • add “sunk” cost of $2000 ($50/hour * 40 hours of training) per incremental staff member
    • use a VAR/RETURN block inside a VAR in the main body of the measure

Add Staff Cost = 
-- how many incremental staff need to be added?
VAR _ScenarioStaff = DIVIDE( [Scenario Hours], [Base Days], 0 )
VAR _IncrementalStaff = ROUNDUP( _ScenarioStaff, 0 ) - [Base Staff]

-- how much will those incremental staff cost?
VAR _IncrementalHours = [Scenario Hours] - [Base Hours]
VAR _IncrementalStaffCost = 
    VAR _IncrementalHourlyCost = 50 * _IncrementalHours
    VAR _IncrementalSunkCost = 2000 * _IncrementalStaff
    VAR _IncrementalResult = _IncrementalHourlyCost + _IncrementalSunkCost
    RETURN
    _IncrementalResult

VAR _Result = _IncrementalStaffCost

RETURN
_Result

Add Overtime Cost = 
-- can we meet the scenario hours with existing staff working 12 h/d?
VAR _IncrementalHours = [Scenario Hours] - [Base Hours]
VAR _BaseStaffAvailableOvertimeHours = [Base Staff] * [Base Days] * 4
VAR _BaseStaffOvertimeCost = _IncrementalHours * 50
VAR _Result = IF( _IncrementalHours <= _BaseStaffAvailableOvertimeHours, _BaseStaffOvertimeCost, BLANK() )

RETURN
_Result

  • added [Scenario 1, 2, 3] measures (use simple measure branching)

Scenario 1 (Base + Pay Penalty) = [Base Cost] + [Late Penalty Cost]

Scenario 2 (Base + Add Staff) = [Base Cost] + [Add Staff Cost]

Scenario 3 (Base + Add Overtime) = [Base Cost] + [Add Overtime Cost]

  • added [Minimum Cost] measure using 2 cascading MINs to determine minimum of all scenarios; added to “Project” table

Minimum Cost = 
MIN(
    MIN(
        [Scenario 1 (Base + Pay Penalty)],
        [Scenario 2 (Base + Add Staff)]
    ),
    [Scenario 3 (Base + Add Overtime)]
)

  • added [Minimum Scenario] measure using SWITCH TRUE to determine the scenarios that are the minimum; add to the “Project” table
    • (in retrospect, should have added a block to check if all 3 scenarios were equal [were all the minimum])

Minimum Scenario = 
SWITCH( TRUE(),
    [Scenario 1 (Base + Pay Penalty)] < MIN( [Scenario 2 (Base + Add Staff)], [Scenario 3 (Base + Add Overtime)] ), "S1",
    [Scenario 2 (Base + Add Staff)] < MIN( [Scenario 1 (Base + Pay Penalty)], [Scenario 3 (Base + Add Overtime)] ), "S2",
    [Scenario 3 (Base + Add Overtime)] < MIN( [Scenario 1 (Base + Pay Penalty)], [Scenario 2 (Base + Add Staff)] ), "S3",
    [Scenario 1 (Base + Pay Penalty)] = [Scenario 2 (Base + Add Staff)], "S1, S2",
    [Scenario 1 (Base + Pay Penalty)] = [Scenario 3 (Base + Add Overtime)], "S1, S3",
    [Scenario 2 (Base + Add Staff)] = [Scenario 3 (Base + Add Overtime)], "S2, S3",
    BLANK()
)

Data Visualization:

  • added “Scenarios” table, and add [Scope % Change] column of [Scope % Change] table
  • used FORMAT \ EDIT INTERACTIONS with [Scope % Change] slicer selected as PRIMARY, then set NONE on SECONDARY “Scenarios” table
  • added [Base Hours], [Scenario Hours], and [Incremental Hours] measures
  • added [Base Cost], [Late Penalty Cost] measures
  • added [Scenario #] (1, 2, 3) measures
  • added [Minimum Cost] and [Minimum Scenario] measures

From the “Scenarios” table, I was able to see that below 25% scope change, S3 (add overtime) was the minimum cost option, while above 25% scope change, S1 (pay late penalty fee) was the minimum cost option. (At 25% scope change, both S1 and S3 were minimum cost options.)

Here’s the link to my solution video on YouTube:

Here’s my solution PBIX:
Problem of the Week 11 - Project Balance - Greg Philps.pbix (46.3 KB)

Thanks to all those who submitted their solutions, and hopefully this POTW gave you a chance to individually exercise your knowledge and see where your at in your learning lifecycle.

All the best.
Greg

3 Likes

All,

A huge thanks to @Greg for a terrific job in developing and leading a really innovative twist on the the Problem of the Week framework, and to @chrish, @deltaselect and @jbressan for posting their excellent approaches/solutions.

As Greg said, this is a wonderful exercise to benchmark where you are in your Power BI journey. If you attempted it, but only got partway to the end, that’s fine - continue to hone your skills and come back to it down the road to gauge your progress. If you took a look at the initial post and didn’t feel you had the skils and/or time to attempt it now, that’s fine too - our intent is really to build the equivalent of a 24-hour Power BI “gym”, where whenever you have time and inclination you can come, “work out” an area you want to strengthen via the accumulated library of problems (all available on the portal site), and get coaching through the associated forum posts and videos.

Over the next few month, along with @sam.mckay and the @EnterpriseDNA team, I will be conducting a series of assessments, discussions and analyses of our initiatives including Problem of the Week and the Data Challenges among others to try to figure out how well these programs are meeting your needs and how we can achieve even greater community involvement. However, in the interim we welcome (crave, actually…) your feedback, whether you participate or not. If you don’t participate, providing us insight as to why not is critical to our efforts to understand and meet the needs of our entire membership. Feel free to post your thoughts and feedback in the relevant thread, or send them directly to me at brian.julius@enterprisedna.co.

Finally, a word of apology to the POTW participants. My execution of the sticker mailings has been a hot mess. For the past five months, I’ve basically been working two full-time jobs, and in that craziness, one of the things that slipped was the sticker mailings. However, I am now dedicating my attention full-time to Enterprise DNA and will straighten that all out this week. So, if you’ve patiently been waiting for a sticker, my apologies - I promise it will go out (with interest) by this weekend, and run smoothly from this point forward.

We will be back next week with a Power Query problem, led by resident PQ guru @Melissa. See you there…

  • Brian