Hi everyone,
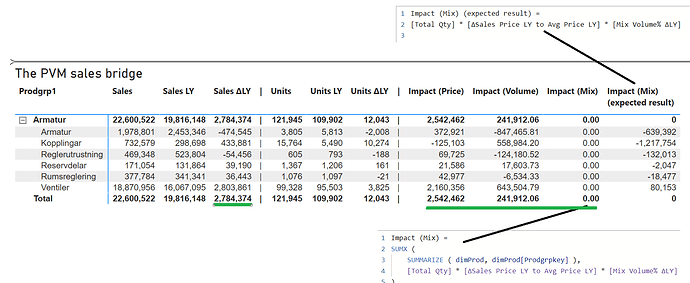
I have experimented back and forth with different methods to produce a Price Volume Mix (PVM) Variance Analysis with the help of power bi but got stuck on what I believe is the context transition.
I cant get the different calculation to show the correct numbers in PBI even though i use the exact same formulas as I use in excel. I have attached the excel file as a “cheat sheet” but it also included the factTable.
The sumx over DimProd is showing 0 for all the rows and and the subtotals and totals 
and the overall mission is that Sales ΔLY should equal the sums of the green line (i.e PVM)
Please help me find what I am doing wrong 
Price – How much of the sales difference can be attributed to price changes?
Price effect refers to what happens when you apply higher or lower prices per unit when all else is equal/static (volume, cost/margin and mix etc).
Calculation: Price effect = Qty * Price ΔLY
Volume – How much of the sales difference can be attributed to changes in quantity?
Volume effect refers to the variation in the number of units sold when everything else is equal/static (price, cost/margin and mix etc).
Calculation: Volume effect = (Qty ΔLY * Price LY ) - Mix effect
Mix – How much of the sales difference can be attributed to mix changes?
Mix is the sum of changes in relative contributions at a given level of aggregation (an assortment, etc.) that is, the percentage of units sold per row vs the total at a given level of aggregation.
Calculation: Mix effect = Total Qty * (Price LY - Avg price LY) * Mix Volume% ΔLY
PVM walk through.pbix (117.7 KB)
PVM walk through.xlsx (55.4 KB)

