Hello @Matty,
Firstly, I would like to apologize as I got caught up in some work and was not able to provide the explanation. So here’s the explanation about the transformations that I’ve made and if you’ve checked the file you might have I converted one table into the two tables i.e. Fact Table and the Dimension Table.
Part 1: Keeping the Imported Data as it is.
In the PBIX file, I’ve kept the original data as it and have created two reference tables from it. One will help me in preparing the Fact Table while the other will help me in preparing the Dimension Table. And after creating the two reference tables from I’ve right - clicked on the original table and unchecked the “Enable Load” option because this table now will act as “Supporting Table” for me. That is I still want the data to be loaded in my PBIX file just don’t want to be loaded in my report.
Part 2: Creating the Fact Table
Now, moving further the first table which I’d referenced will be converted to the Fact Table. Since the data was in the horizontal format my first priority was to convert both these referenced tables into the vertical format.
Step 1: I’ve to remove Top Row (Row No.1) since that was not required for me at all. And just to remind you when you’ll refresh your dataset I won’t show error because we’ve kept the original data as it in our PBIX file and these the referencing tables so no need to worry about that.
Step 2: Promoted my first Row as Headers.
Step 3: Changed the Type and Unpivoted the Date columns which were in the horizontal format.
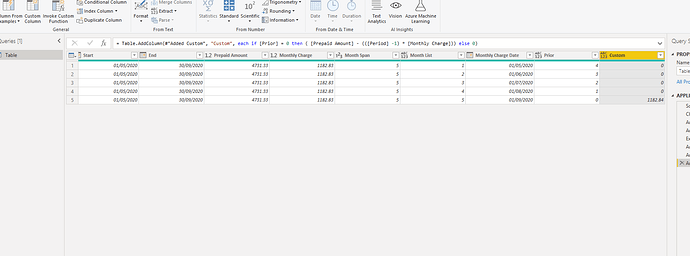
Step 4: Now, here’s the main part after unpivoting the data if you see figures in the Invoice Amount, Prepaid Amount and Monthly Charge started getting repeated which was wrong. Because this figures were determinable only once and if we load our data here and start making analysis we get utterly wrong figures so I removed those columns from the table. Below is the screenshot provided for the reference -
Still I performed two more steps but they’re miscellaneous.
Part 3: Creating the Dimension Table
Now since I’d deleted those 3 columns we need to bring those 3 columns in our analysis in the form of Dimension Table and transform our data in such a way that this figures appear only once since they’re determined at the start of the period. So all the transformation steps remain the same only the change which I made in this case was to retain this 3 columns and delete the other remaining columns.
Part 4: Creating Date Table
Lastly, since all our analysis is based on the date itself, I created the date table. And now, we’ll click on the “Close & Apply Button” and now to the “Modelling View”.
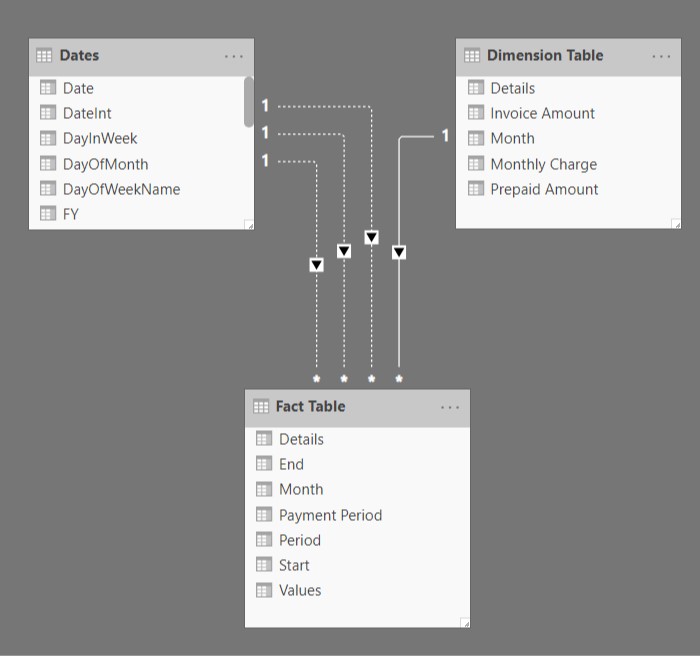
Now, since you’ve 3 date columns in your table i.e. Month, Start and End. I’ve created inactive relationships with the Date table and between Fact and Dimension table one column is common and that is Details so I created one active relationship there.
So now, the end result should look like as per the screenshot provided below -
Now, to make this relationship active you can definitely use the USERLELATIONSHIP() function and carry out or perform the analysis as desired.
I know the explanation got bigger but hoping you’ll find this useful and helps you in your analysis  . I’m also attaching the the Excel as well as PBIX file for the reference.
Thanks & Warm Regards,
Harsh
Prepayment.xlsx (13.0 KB)
Power Query Transformations.pbix (114.2 KB)


 . I’m also attaching the the Excel as well as PBIX file for the reference.
 Thank you.


