Power BI Model - Help with DAX Calculation or Data Model structure

Hi,

My DAX/Power BI Knowledge is beginner to intermediate.

I’ve completed 4 modules already on this great site but this model has myself a little confused.

Can anyone help in pointing myself in the right direction please.

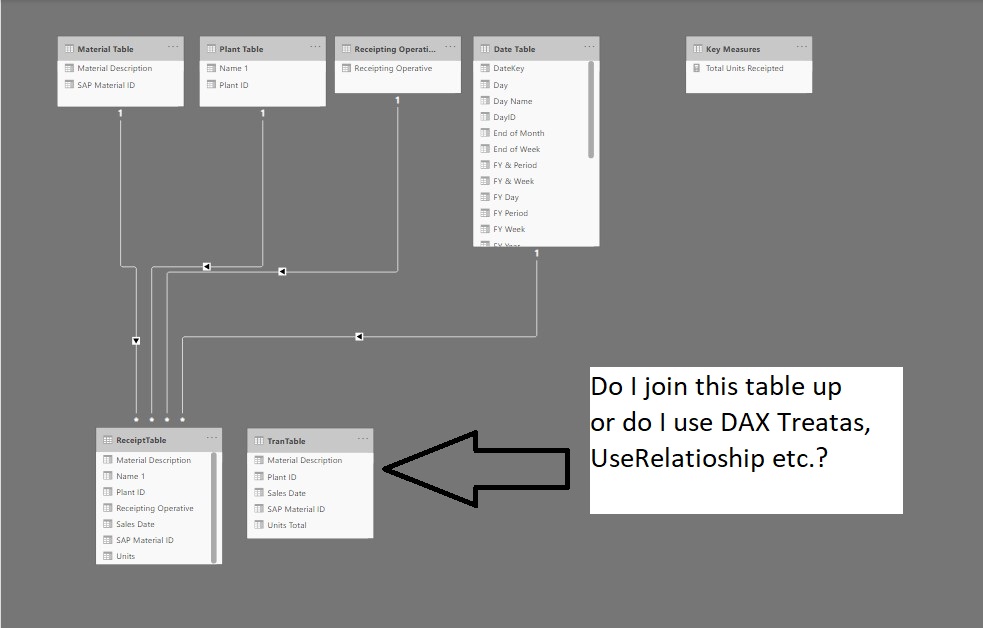
My company has many Depots and Bakeries, each site takes delivery of products which are receipted throughout the day in SAP (BIS1)
The same SAP System also books the picked products to the van later (TRAN) on the following morning (Sales Date)

To protect company data,

I have renamed the products to 1 to 23 etc.

Warehouse Operatives renamed from 1 to however many there is in the data set.

Each Warehouse Operative will and can receipt many deliveries per shift into SAP.

The same deliveries will also have 1 or many products onboard to Receipt, different amounts for each product and some products may arrive over 1 or more deliveries by same or different operative.

Our operation is a 24 hour window.

I have also stripped the dummy demo data set to 2 sites only. (Google Drive Link to the Excel Data Set)

All product lines are then picked/loaded to each Van for delivery. (Usually following morning - Sales Date)

In essence in an ideal world - Blue Sky Thinking :slight_smile:

The total Sum of units that are receipted into the Warehouse should balance with what is loaded out to total Sum in units to all the vans of the same site.

My goal and desired KPI metrics are:

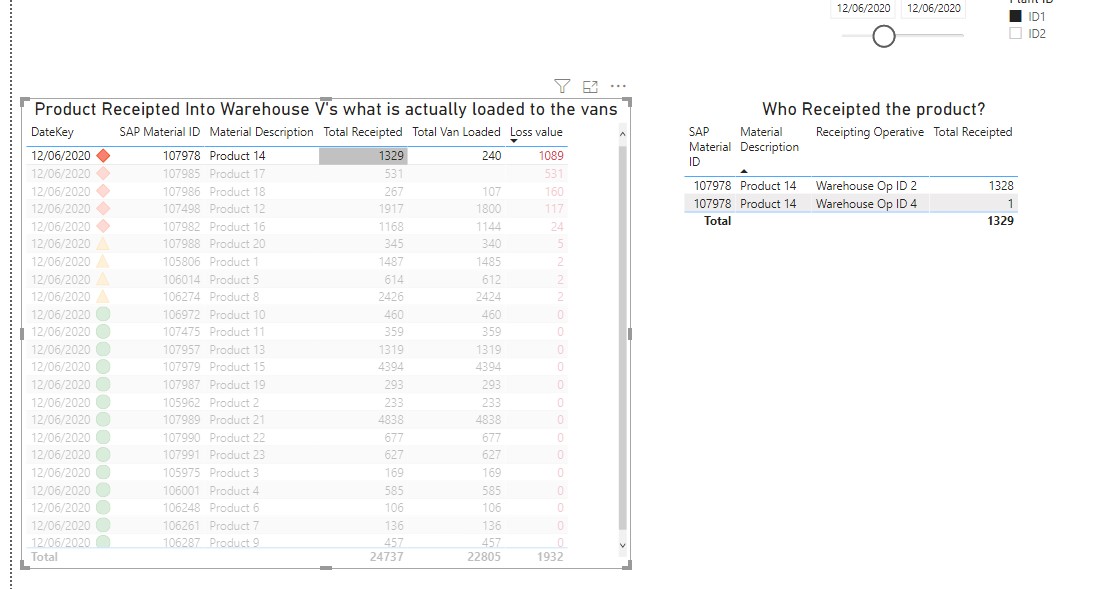
Establish how many units were receipted into the Warehouse for the next days Sales Date.

Total number of units for each individual product.

How many units in total are then loaded to the vans for each product.

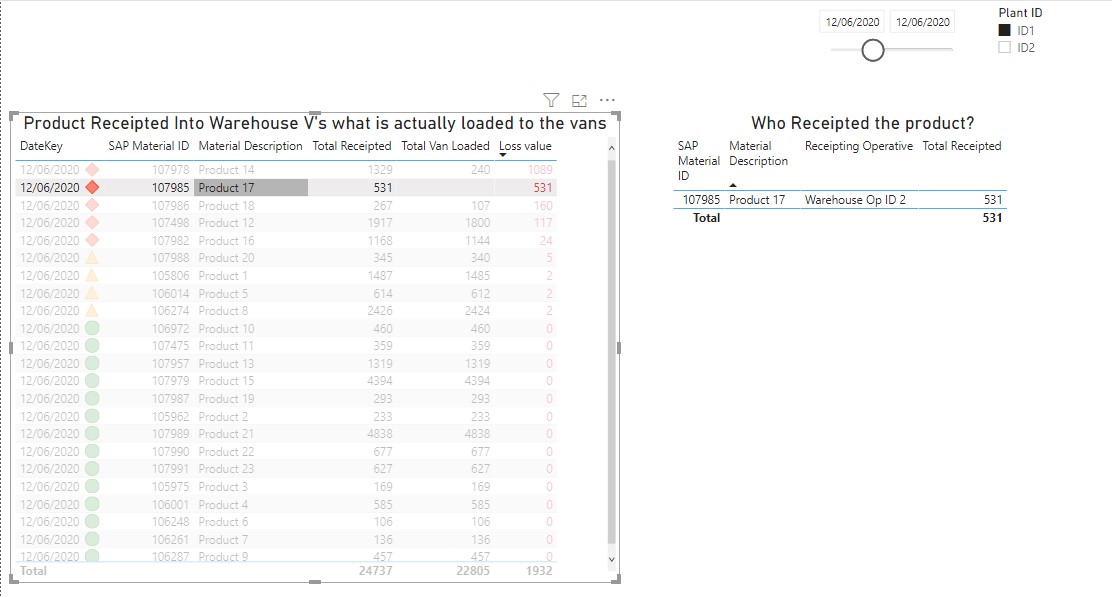
Does it match (Balance off) for each product? - Visual for Dashboard

Where the products do not balance off (Difference in Units = Loss)
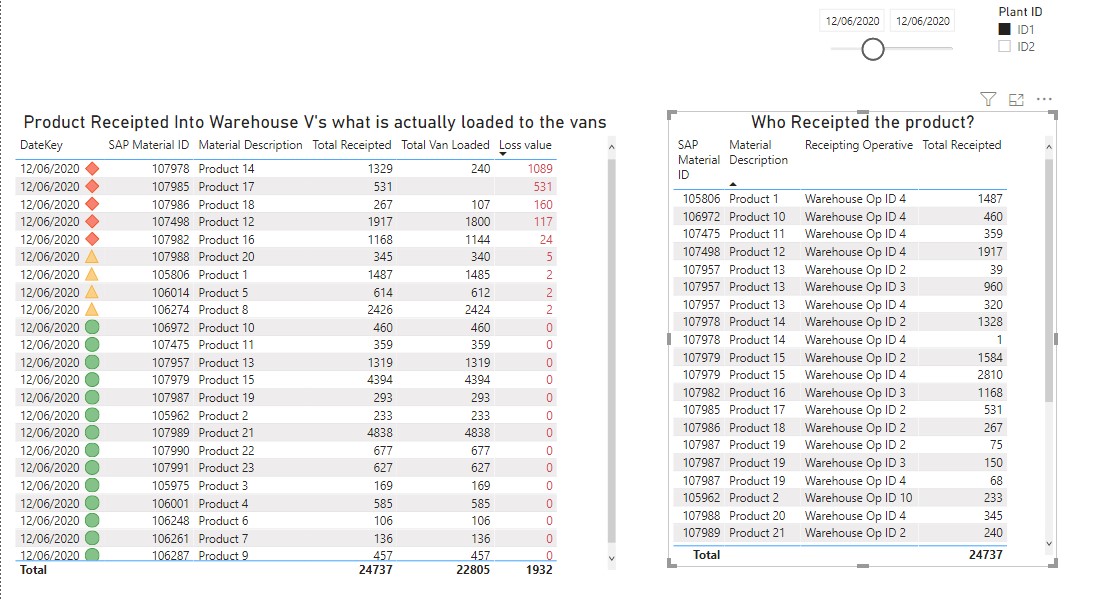
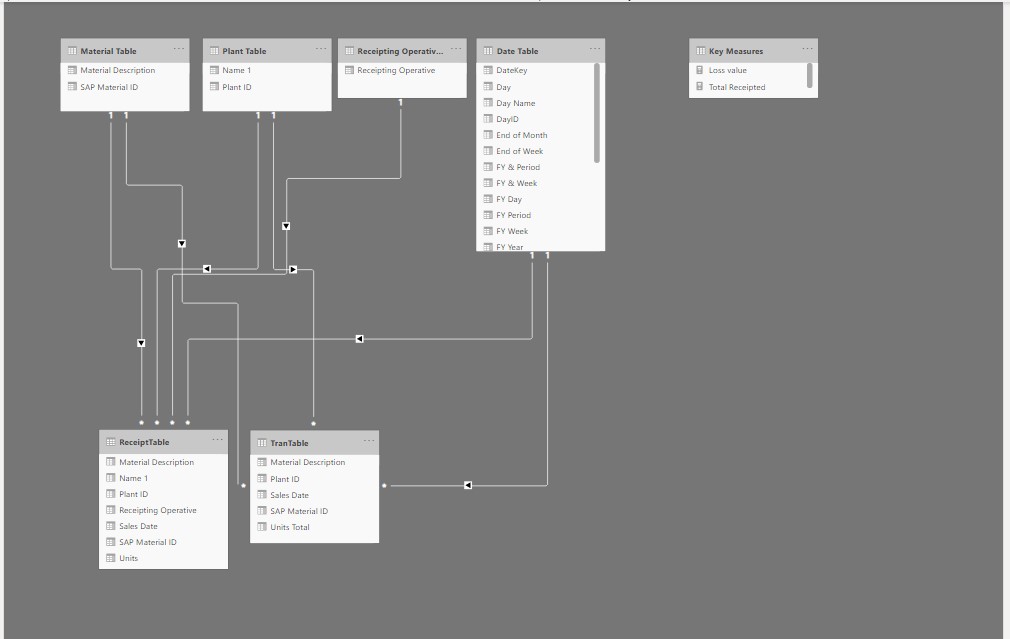
I would like to count the Warehouse Operative ID who receipted that product into the Warehouse, is there a pattern or trend? - Struggling to get the relationship right on this one for the data to flow back correctly, most likely because I’m using 2 data table? I’m not sure?

Process Fails that i wish to capture from the SAP Data

However some operatives take shortcuts, fail to check in correctly (Count all the product in, check that all the Stacks, Baskets and units are actually there)

This can then create major differences of what we are actually charged for (Receipts) V’s what we load out to the vans.

A few units here and there is acceptable as units are sometimes missing from a basket (Acceptable/Also damage products)

Please find attached screenshots,

Power BI Desktop File and Excel Data Forum Dataset.pbix (165.9 KB) set

Forum Dataset.pbix (165.9 KB)

Excel Data set GDrive Link

Hi @DarrenG, we aim to consistently improve the topics being posted on the forum to help you in getting a strong solution faster. While waiting for a response, here are some tips so you can get the most out of the forum and other Enterprise DNA resources.

  • Use the forum search to discover if your query has been asked before by another member.

  • When posting a topic with formula make sure that it is correctly formatted to preformated text </>.

  • Use the proper category that best describes your topic

  • Provide as much context to a question as possible.

  • Include demo pbix file, images of the entire scenario you are dealing with, screenshot of the data model, details of how you want to visualize a result, and any other supporting links and details.

I also suggest that you check the forum guideline https://forum.enterprisedna.co/t/how-to-use-the-enterprise-dna-support-forum/3951. Not adhering to it may sometimes cause delay in getting an answer.

Thanks for the detail here.

Why haven’t you connect the other fact table to the lookup tables also? I see many of the same common columns, like dates, plant, materials.

Once the Trantable is linked up as well you can start filtering both fact tables at the same time from the lookup table layer

Sam

1 Like

Hi Sam,

Many thanks for your reply and assistance.

After posting the first screenshot and asking the question I decided to do just that and join both fact tables up as you have suggested, see attached screenshot V2

I then hit a problem when I tried to see the following information via a Table Visual

Receipted Units from the Receipt Table V’s the Loaded Units in the Tran Table

Struggled to get the Receipting operative name, I guess that is because the loaded Tran table was not able to flow back up the relationship filter line and pull the Receipting operative from the lookup.

I need to generate a connection/relationship somehow between both tables somehow.

Struggling to work that out at the moment. :confused: :confused:

Link to the raw data set (Excel)

https://drive.google.com/file/d/14aku9eBh8MrxiKTUC2r9n4fuCMvWK2YY/view

Probably the best strategy to use here in this case is to create a new lookup table of the receipt numbers.

Then have that lookup table link to both fact table from the top layer.

Then you should be able to get that insight would be my guess.

Somehow you want to move the common details across both table up to the top part of the model.

Check out this video here where I discussed the technique

And here

Hi Sam,

Thanks for your help and advice, much apreciated.

I will check the video out and explore further.

Thank you

Darren

Hi @DarrenG, a response on this post has been tagged as “Solution”. If you have a follow question or concern related to this topic, please remove the Solution tag first by clicking the three dots beside Reply and then untick the check box. Also, we’ve recently launched the Enterprise DNA Forum User Experience Survey, please feel free to answer it and give your insights on how we can further improve the Support forum. Thanks!