Hi Power BI enthusiasts in Enterprise DNA,
Finally Microsoft has released the Power BI desktop April 2020 update.
Major changes includes the addition of visual personalization, page refresh efficiency improvements, CDM folder view for Azure Data Lake Storage, newly highlighted template apps, Enhancements to Query diagnostics and plenty more.
I have listed out my 5 favorite features below:
- Lasso select for visuals: I was waiting for this tool for long time, it is finally in Power BI Desktop. Now you can multi-select your visuals and any other report elements in the powerbi Canvas by clicking and dragging over.
- Grouping and Ungrouping: This may sound very simple but it is important shortcut, now you can use CTRL + G to Group and Shift + CTRL + G to UnGroup your visuals in Power BI.
-
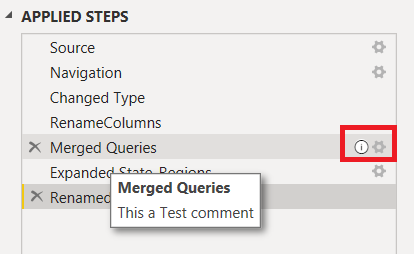
Conditional formatting for totals and subtotals: This is again a cool option available post April update, now you can apply conditional formatting rules to your totals and subtotals in table and matrix visuals. Cool na
 . You can find this new option in the Apply to dropdown in the conditional formatting advanced controls dialog box.
 - Icon for Conditional formatting: They have included icon (fx) for conditional formatting to make it more discoverable. This button/icon can found to the right of the object you would like to format.
-
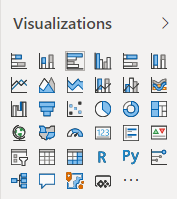
New visualization icons: Now Power Bi has got new Visualization icons with higher color contrast to improve accessibility.
May 2020 Update is out: Power BI Desktop's May 2020 update brings Apply all filters, Filter pane migration, new connectors and more
Do post your favourite features below by reply.
 ,
,