It’s never to late for building PowerBI skills and to try something new.
I use Jira dataset and visualize in a high level Kanban like form – divide it in 3 main parts – Backlog , In Progress and Done.
Also add distribution by this Status Groups + add Canceled for Current Year and For Total.
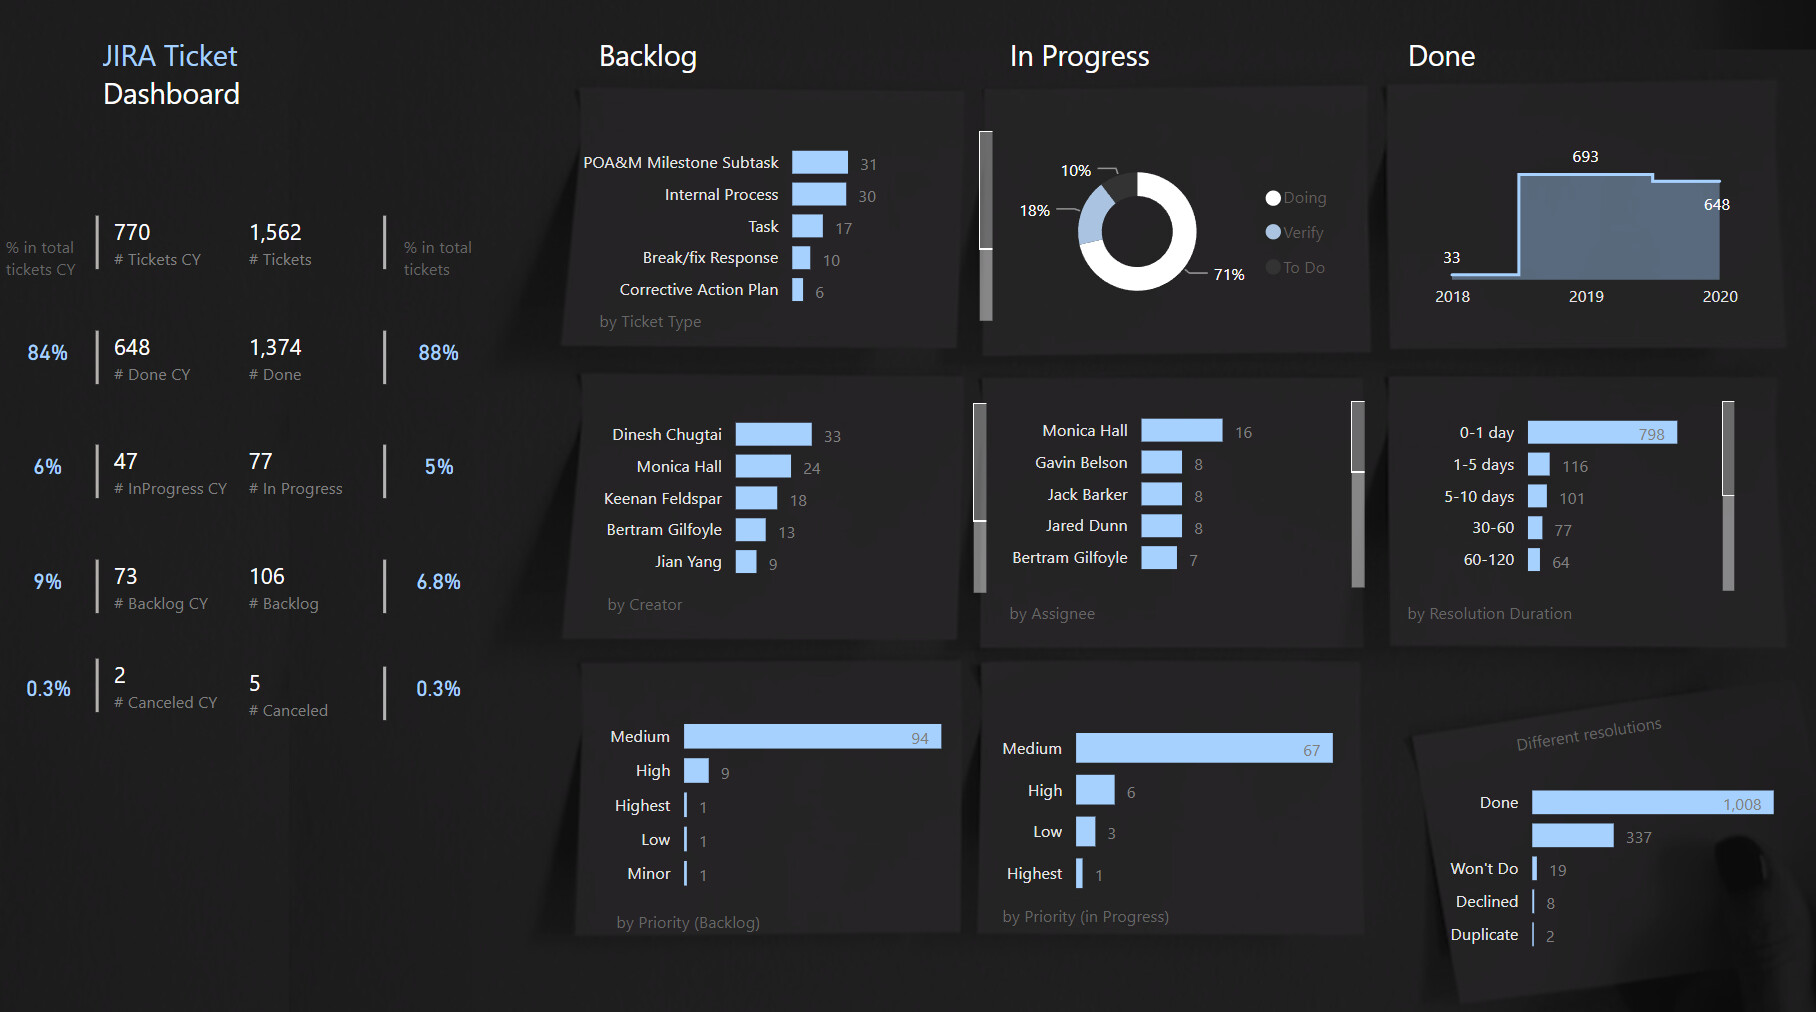
Also split Backlog by Creator and In Progress by Assignee because in Jira we mostly struggle with this.
For Creator and Assignee name extraction from e-mail some transformations were done in Power Query.
Everything is interacting.
Web Link:
Hope you like it.