Power BI Challenge 8 - Jira IT Service Desk Analysis Entry from Preety (non-member)

Here’s the entry from one of our non-member participants, Preety.

2020-10-28 (13)

2020-10-28 (14)

2020-10-28 (15)

Here’s how Preety described it:
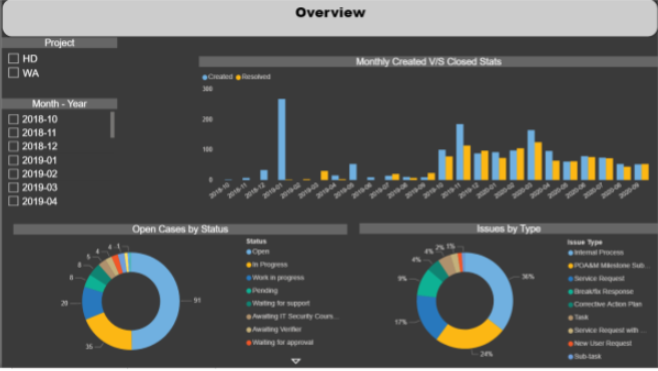
1. Overview page

Filters -

· Project Name

· Month- Year

Visuals description-

Monthly Created v/s closed – This gives a count of incident created and closed every month.

Open Case by Severity – Gives distribution on Open case by severity

Issues by type – Distribution of all the incidents raised by Type.

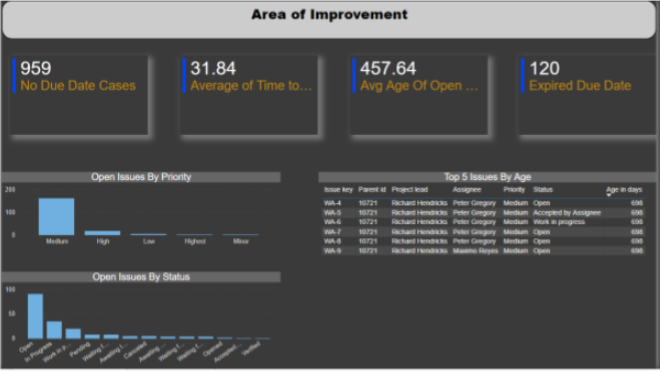
2. Area of Improvement

The top row gives the general information as what can be improved by

Number of incidents missing due date,

Average Time to resolve – Average of days taken to resolve an issue from the date it was created.

Average of Open Cases - Average of days incident is open (Today) from the date it was created.

Other 2 visuals give count of Open cases by Severity and status.

Top 5 issues by age – Lists the 5 issues which are open, in descending order by Age.
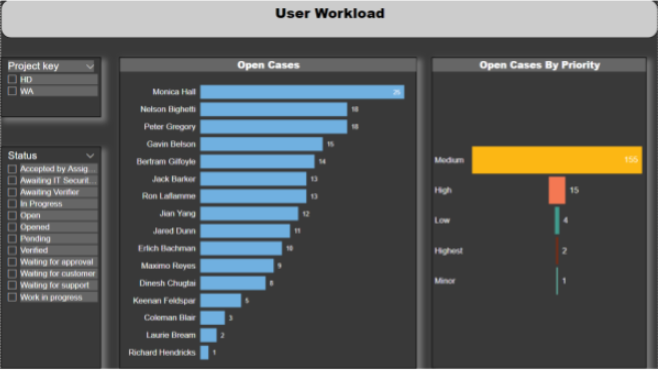
3. User Workload

This page gives information on number of incidents a user is assigned with i.e. currently working on and its distribution by Priority. The slicers used are Project name and status of incident.

To learn about the real-life scenario presented for the challenge, be sure to click on the image below.

power-bi-chal-1

Congrats on your submission here and appreciate the efforts that you have gone into working through the challenge.

Certainly you want to try and build into your own workflow some simple best practices around analysis and report design.

Some of the things to consider here are making sure you place insights into grids within a report page. Also having a consistent color palette. And also just have a bit more of a think about making key insights stand out.

Whilst you’ve got some nice visualizations here I think you wanna also make sure you’re telling a good story and so there’s some improvements I think you can make around that.

I would make sure to look through some of the other submissions and try and get inspired by the creativity that has been on show. Things like improving your title area, also your overall navigation around your report. There’s so much you can do in power BI now so it’s worth having another go in the future and really challenging yourself too do something more compelling.

But congrats on working through this. I’m hoping that you learned a lot and can participate more in the future as you learn and grow with power BI.

Sam