Here’s the entry from one of our non-member participants, Mosbehi.
Here is the link to the report:
And here’s how Mosbehi described it:
This my first submission for Enterprise DNA Challenges, so after I read the brief and dig into the dataset many times, the first question came to my mind is “WHAT IS JIRA?”, yes and to be honest, I know the name but I don’t really know what is Jira? and like the challenge 8 said “IT’S ALL ABOUT JIRA” and this is the beauty of challenge, it opens the door to learning new things that we did not know before, so I googled it.
From the dataset and after some optimization, I came out with this Model below:
-JiraTickets (Fact Table)
-Projects | IssueType|IssueSatus|ProjectType|Dates (Lookups Tables)
PS: I use M code (by Melissa) to create the Dates Table
Extended Date Table (Power Query M function)The second challenge for me is to create a “Simple” interactive report which anyone can interact with. From the Jira Logo, I picked 3 main color: #123F4E |#E1E1E8 | #2A90B2, also I made my own custom theme from Enterprise DNA ‘s Color Theme Generator.
https://analysthub.enterprisedna.co/colour-theme-generator
Once again from Jira Logo I create 4 different logos for my report (IT’S ALL ABOUT
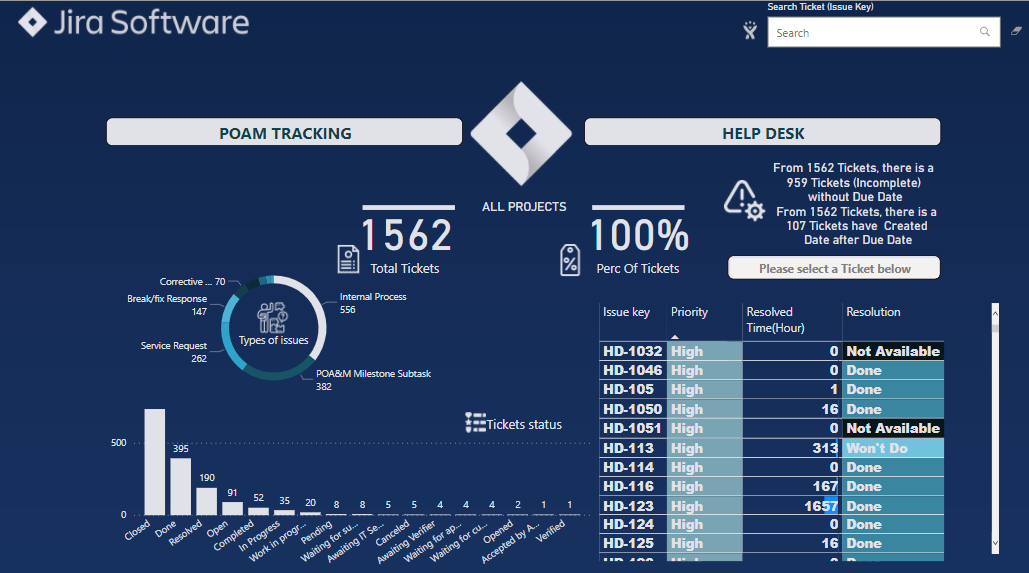
JIRA). I used this site https://manytools.org/image/colorize-filter/ to do it.The next step is combine all this and make a creative report, I noticed from the data that we have 2 type of project name (Help disk and POAM tracking ) so I come up with an idea , I created 3 button one in the middle for all projects and two others for Help disk and POAM tracking and with the help of the two magic tools (Bookmarks and Selection ) and one slicer.
I write also a DAX Measure that change the text based in button clicked.
Text Project =
var _selproj = SELECTEDVALUE(Projects[Project name])
var _text = SWITCH(TRUE(),
_selproj ==“Help Desk”,“HD PROJECTS”,
_selproj ==“POAM tracking”,“WA PROJECTS”,
“ALL PROJECTS”
)
RETURN _textI tried to answer these two questions below by writing a DAX measure that detect issue without due date and others with due date after the created date:
1)How to handle records where the create date is after the due date?
2)How to handle records without due date?Another 2 DAX measures that I should mention :
The Drill Button Navigation and The Drill Button Text
Drill Button Text =
VAR _issuefiltered =
IF (
HASONEFILTER (JiraTickets[Issue key]),
TRUE,
FALSE
)
VAR _selissue =
SELECTEDVALUE ( JiraTickets[Issue key], “All Tickets” )
RETURN
SWITCH (
TRUE (),
_issuefiltered, “See Ticket " & _selissue & " Details”,
“Please select a Ticket below”
)
Drill Navigation Ticket =
IF (
HASONEFILTER (
JiraTickets[Issue key] )
,
“Ticket Details”,
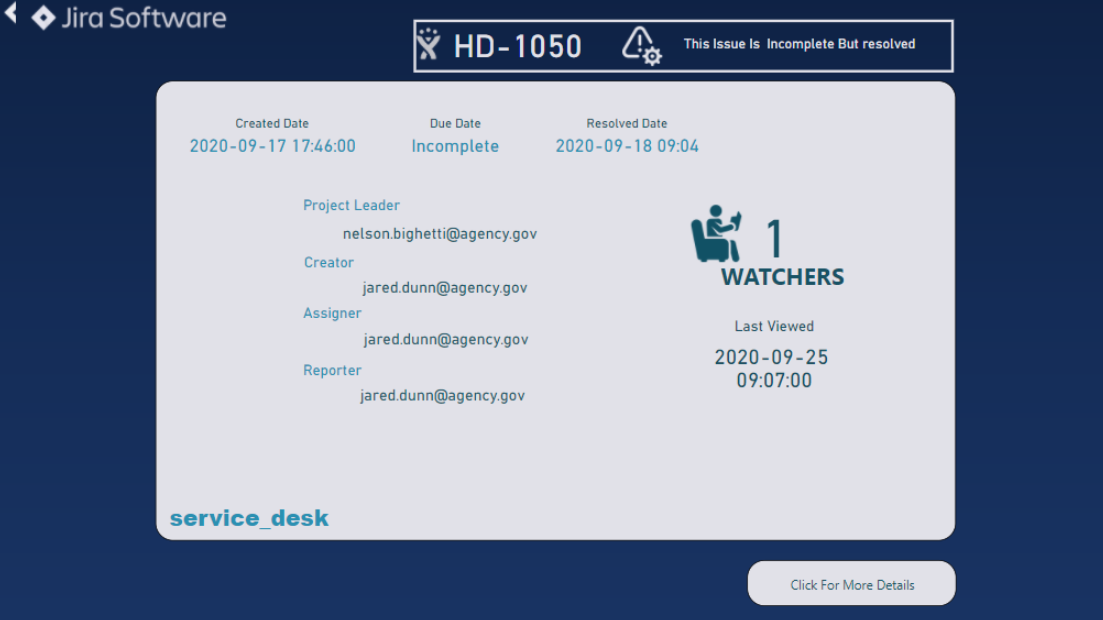
“”)From that button you can pick any issue from table and drill through more details.
From This Button we end up in this page, “Ticket Details”.
I wrote 2 calculated columns for due date and resolved date
Due Date TDetails =
var _due=
FORMAT((JiraTickets[Due
Date]),“yyyy-mm-dd”)
return
IF(
ISBLANK([Due
Date]),“Incomplete”,_due)
To resolve the issue of blank row.Also, another DAX measure to describe the status of issue and some other information.
But when you click in the “Click for More Details”, some others information will be appeared.
- Custom Visual Used: Text Filter By Microsoft
- All icons Used from https://www.flaticon.com/
With Code Color: #E1E1E8Thank You!
To learn about the real-life scenario presented for the challenge, be sure to click on the image below.
