Here’s the entry from one of our non-member participants, Joseph.
Here’s how Joseph described it:
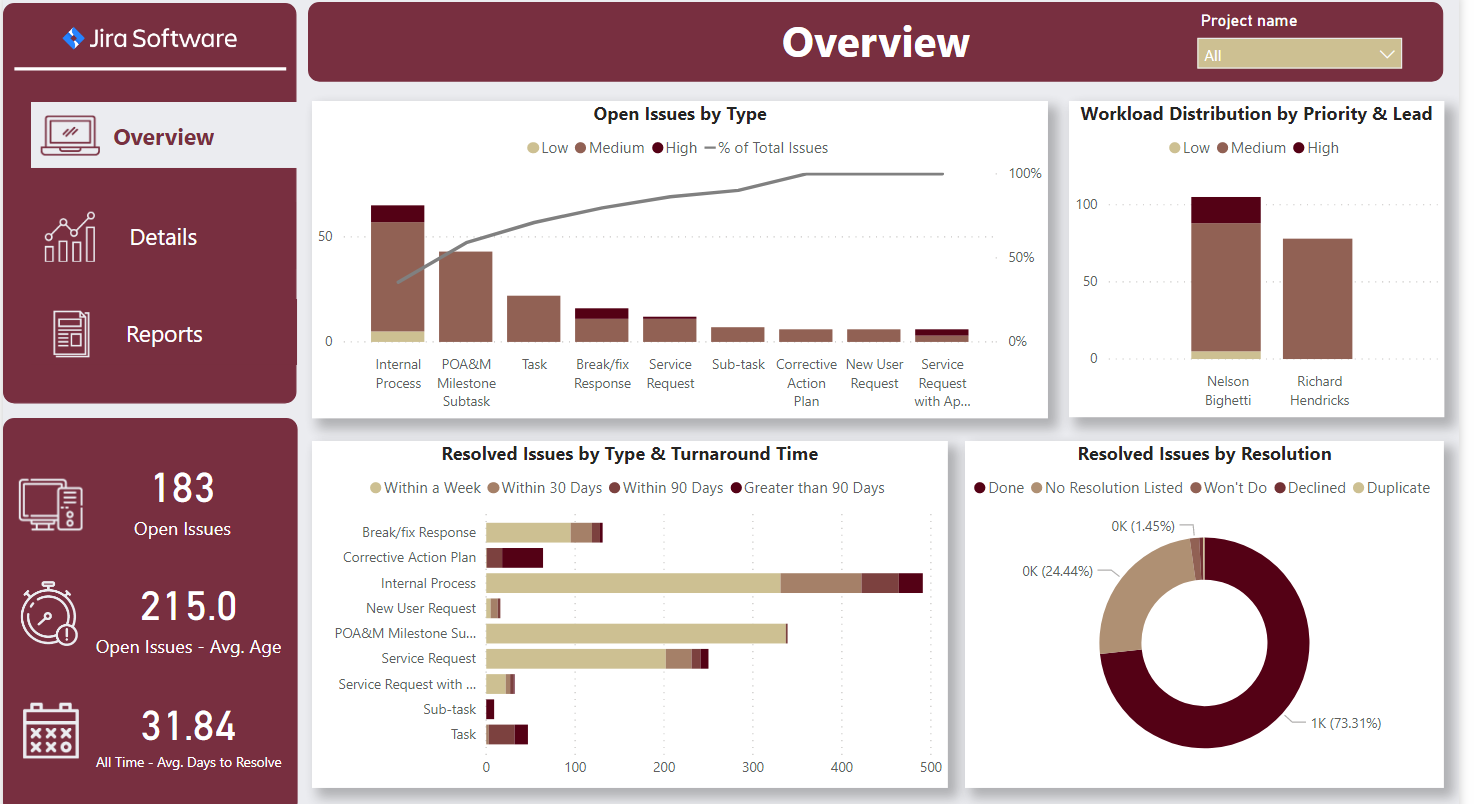
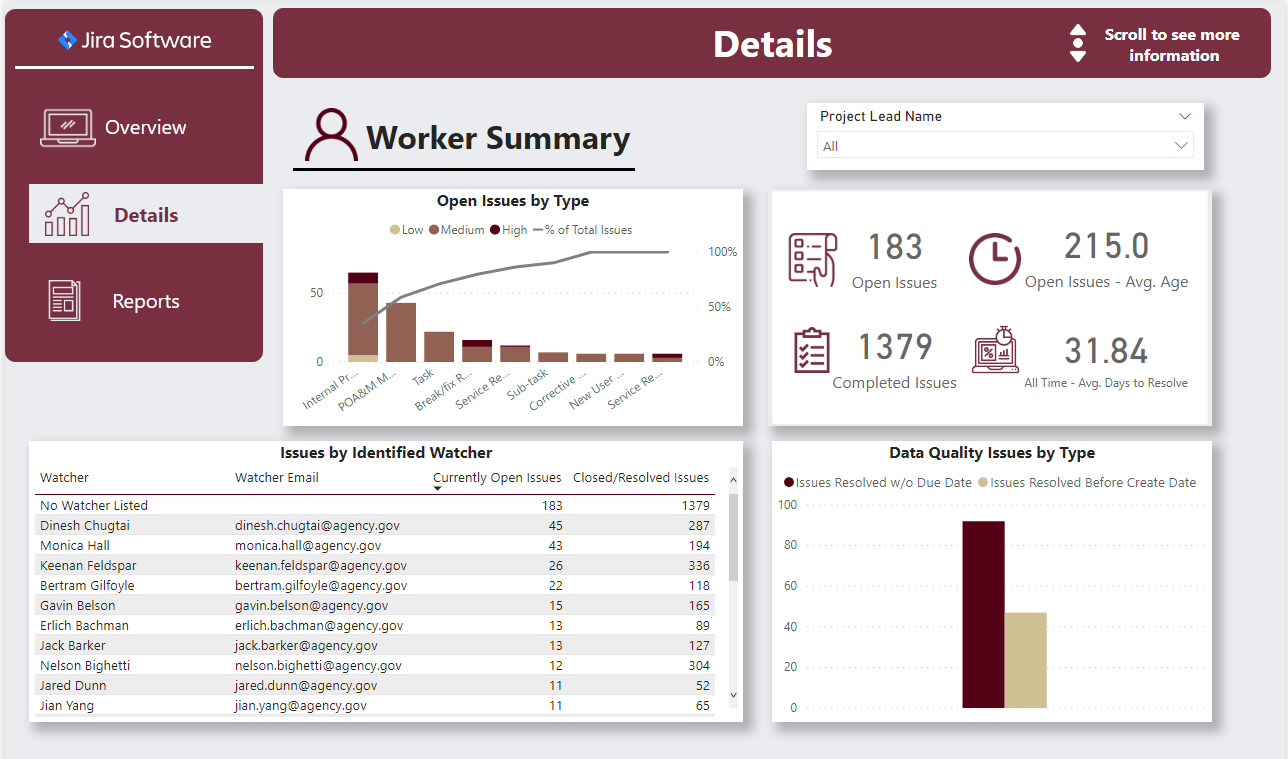
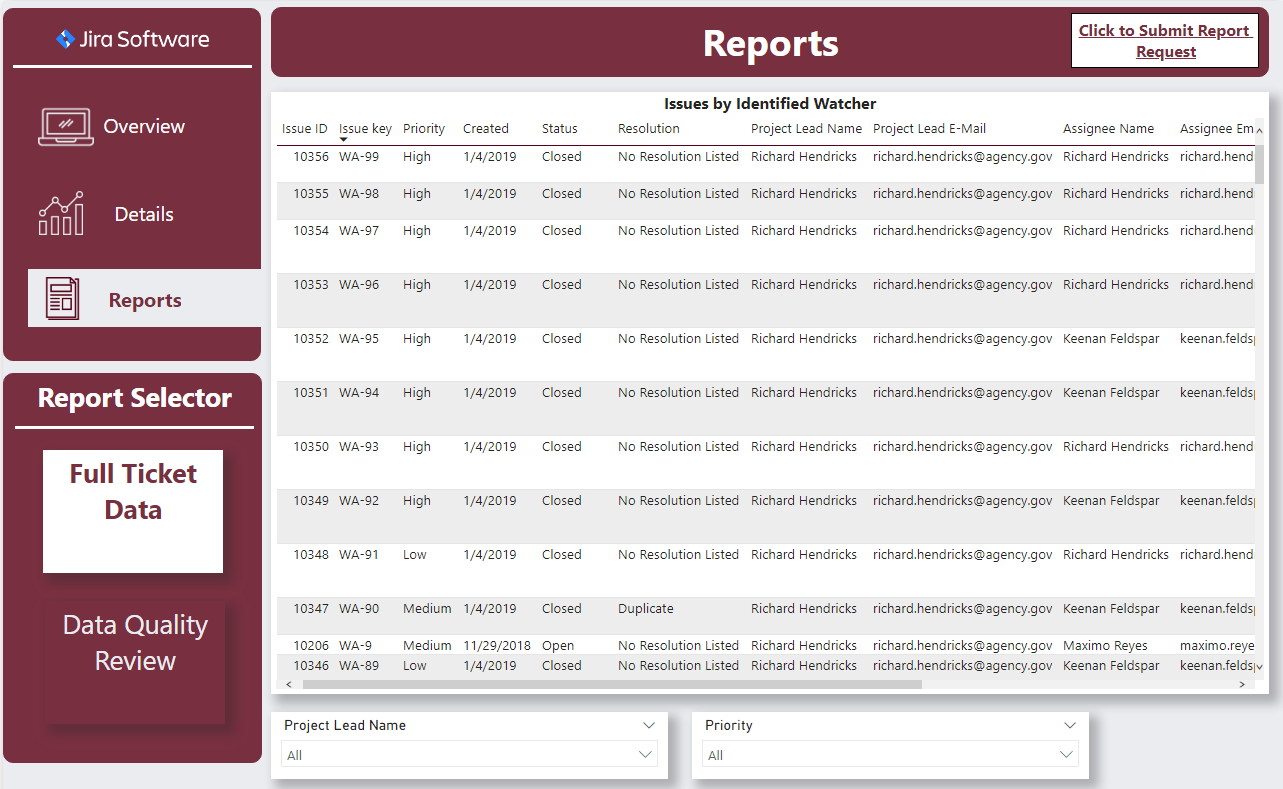
I have created a three-page report that consists of an overview, a detail page, and a report selection page.
Additionally, there is a fourth page that in this instance provides credit to the individual creators of the various logo and symbols used throughout the report.
This report maintains a consistent color theme throughout and is structured in a way to appeal to multiple audiences.
A large portion of users may only require quick data points from the overview while content specialists may utilize the details page.
The reports page has two basic reports with an email hyperlink at the top for users with access to request addition reports for inclusion based on their needs.
I very much enjoyed this challenge and will be sure to keep spreading the word about future ones throughout my analytics network!
To learn about the real-life scenario presented for the challenge, be sure to click on the image below.
