Hi everybody,
Thanks again @EnterpriseDNA for hosting this challenge!
Here is my submission for the 8th challenge with my inspiration creating it.
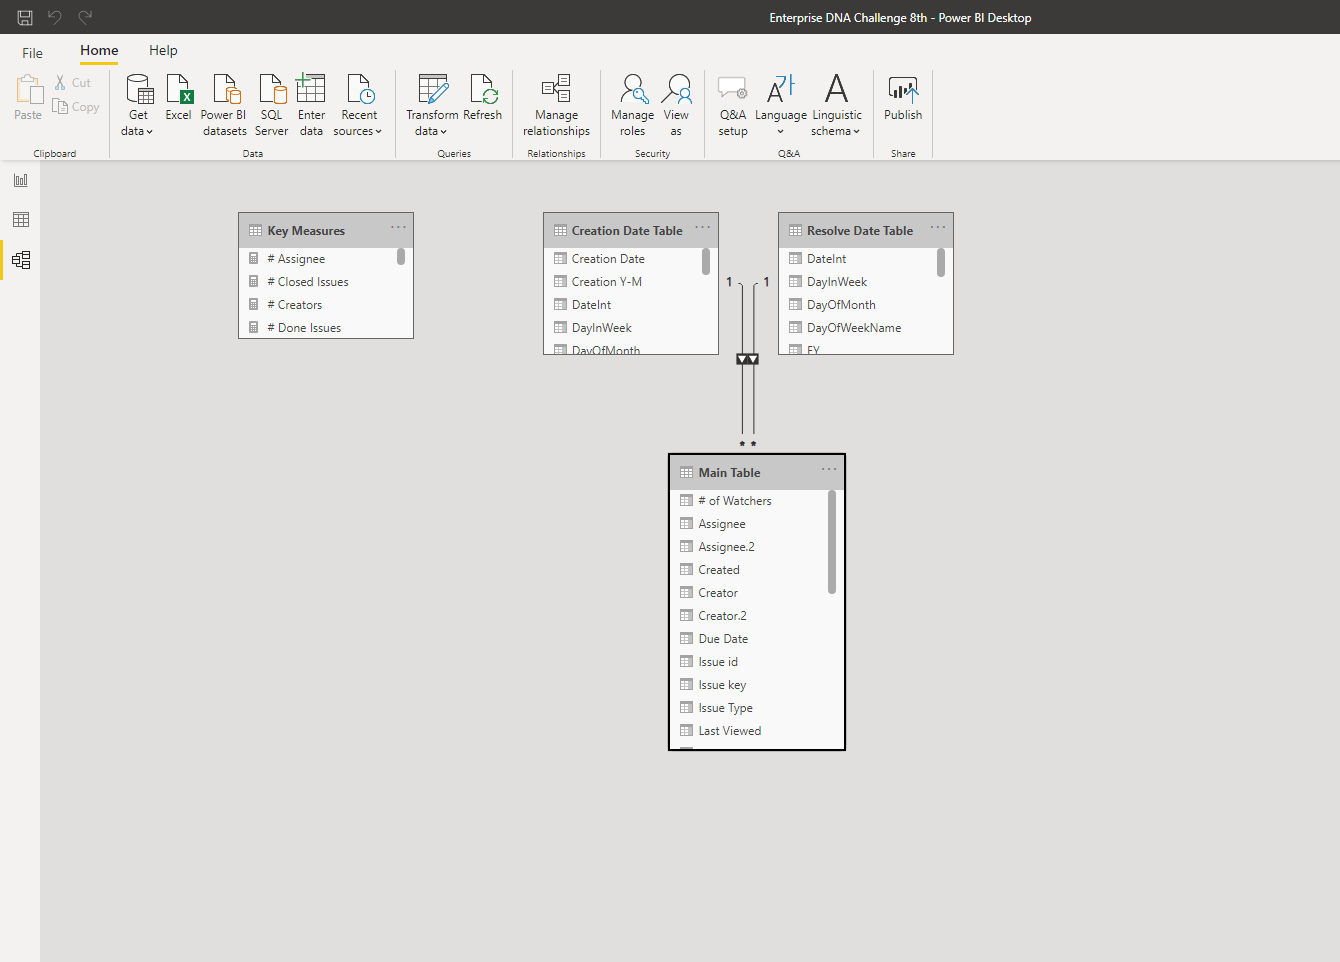
The first Image shows my data model. Since I didn’t have enough time, I decided to keep it simple and just created two distinct Date Table for “Creation Date” & “Resolution Date” columns in the main table. For other categorical columns like “Status”, “Type”, Assignee", etc. also I didn’t create separate lookup tables, and just used their columns in the main table.
If there is any problem with my data model, technically or conceptually, I would appreciate it if you help me to correct it. Any comments would be appreciated.
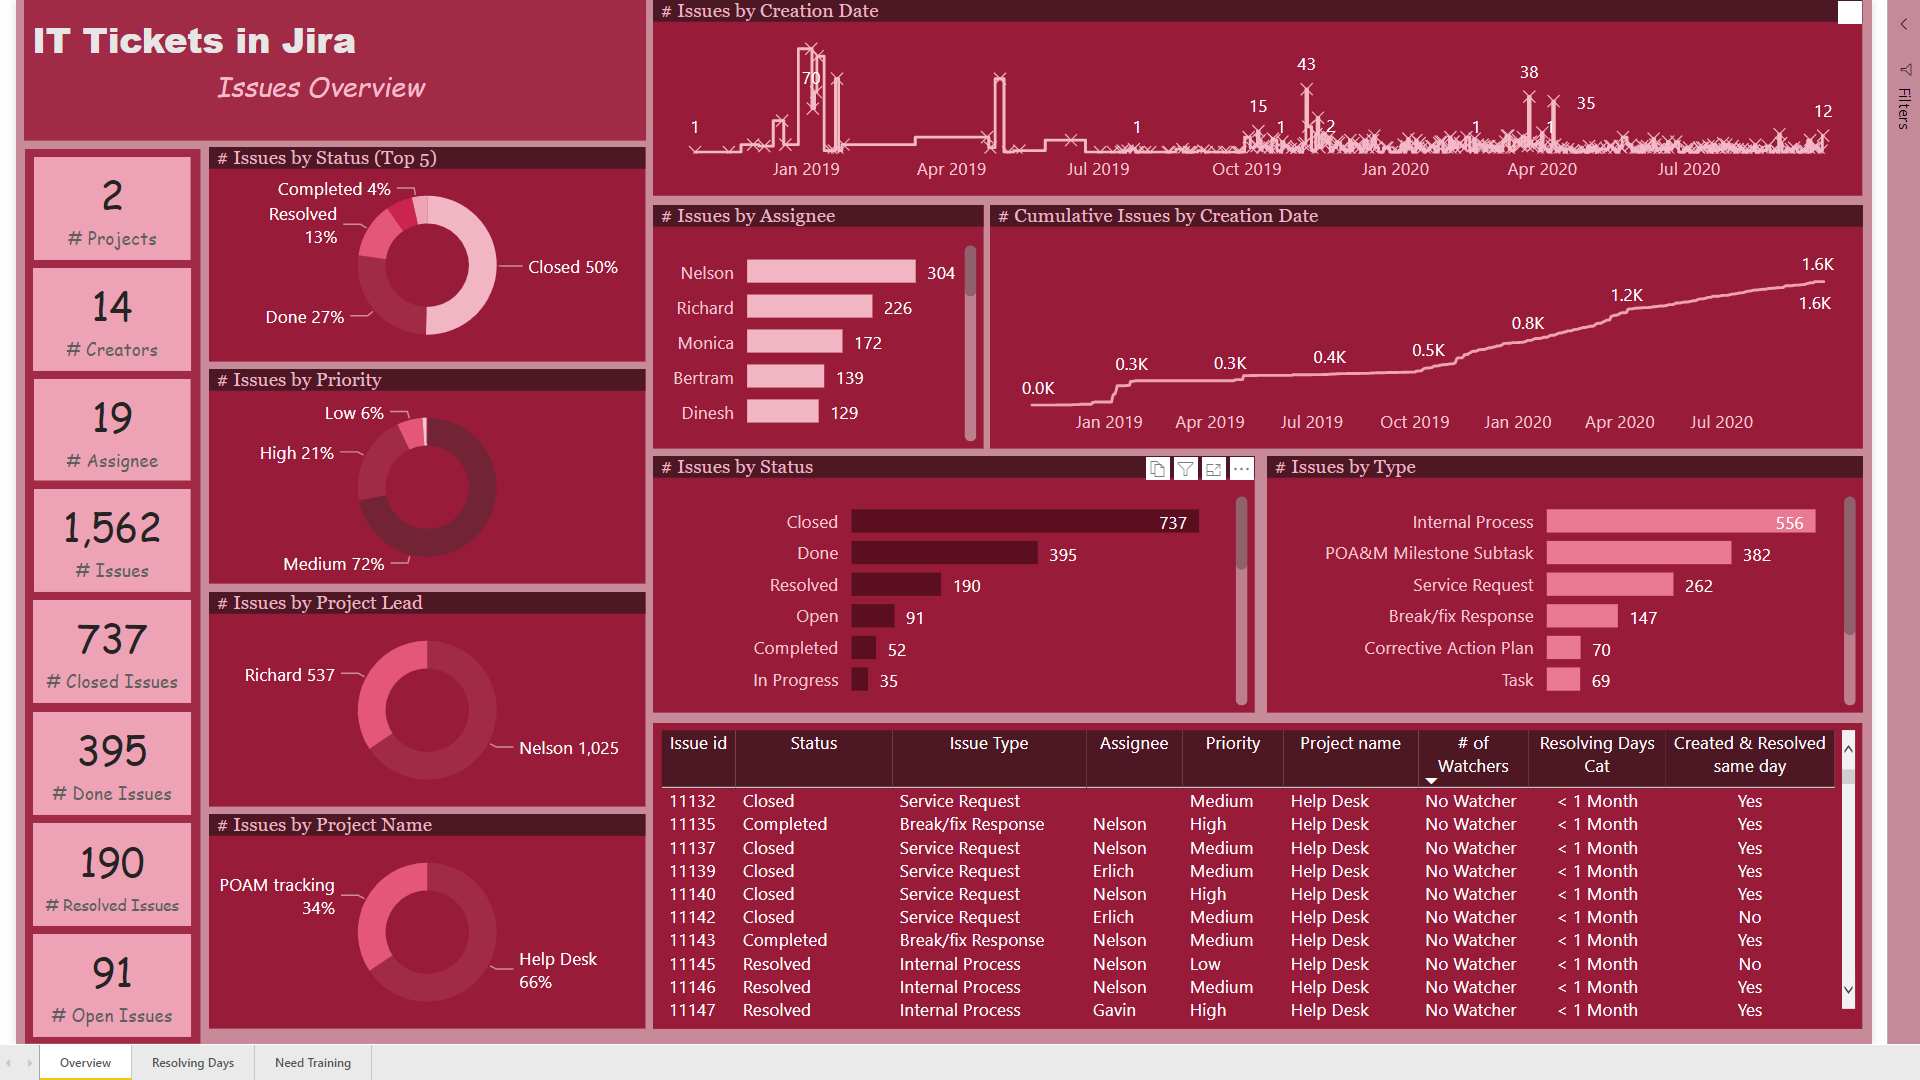
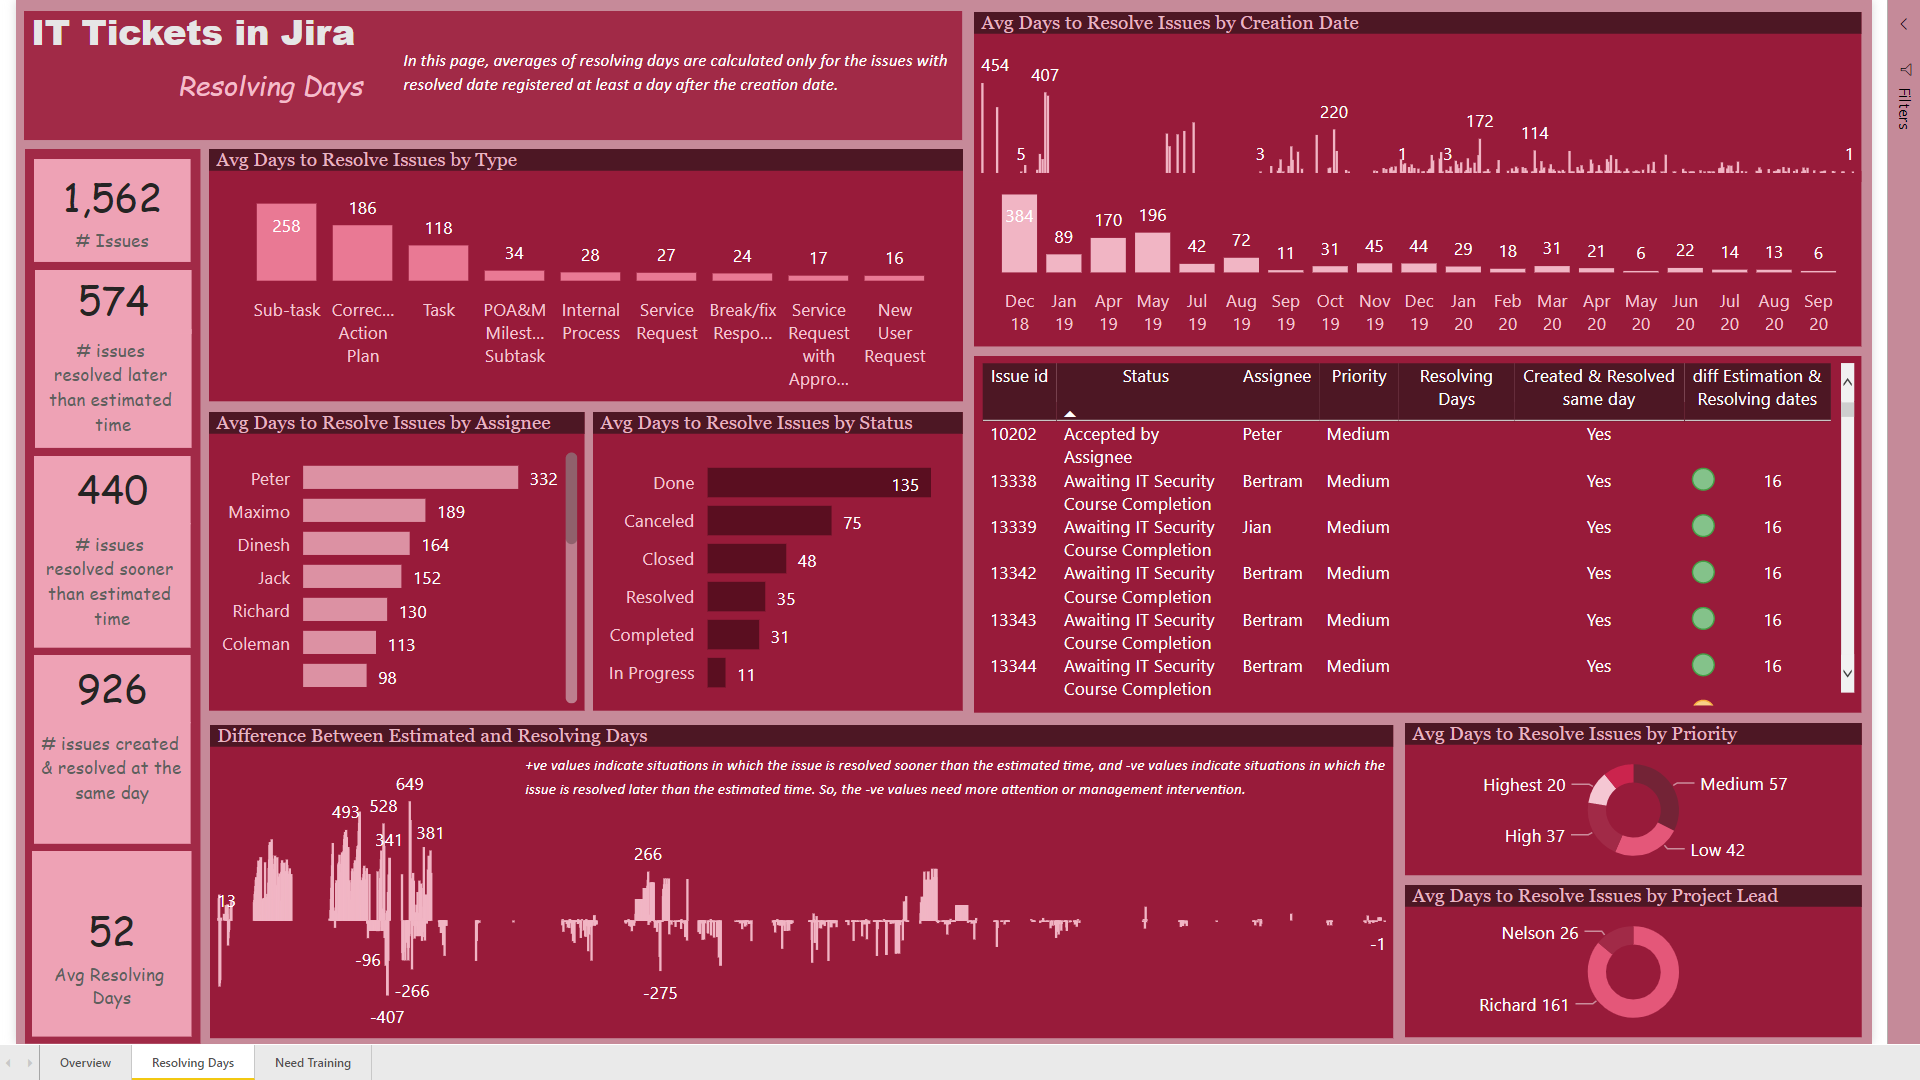
On the first page, “Overview” I just wanted to show some important and basic information about the whole process. Since the amounts of assignee column were emails, I decided to use “Assignee Names” instead of emails using query editor.
Using DAX I created “# of watchers”, “Resolving Days Cat”, and “Created & Resolved same day” measures using measure branching as follows:
# issues created & resolved same day = COUNTROWS(FILTER(‘Main Table’,DATEDIFF(‘Main Table’[Created],‘Main Table’[Resolved],DAY)=0))
Created & Resolved same day = IF( [# issues created & resolved same day]=1, “Yes”,“No”)
Resolving Days Cat =
IF ( [Resolving Days] <= 30, “< 1 Month”,
IF ( [Resolving Days] > 30 && [Resolving Days] <= 60, “1-2 Months”,
IF ( [Resolving Days] > 60 && [Resolving Days] <= 90, “2-3 Months”,
“> 3 Months” )))
# of Watchers =
IF ( ‘Main Table’[Watchers] = BLANK (), “No Watcher”,
IF ( ‘Main Table’[Watchers] <> BLANK () && ‘Main Table’[Watchers_4] = BLANK (), “1 Watcher”,
IF ( ‘Main Table’[Watchers_4] <> BLANK () && ‘Main Table’[Watchers_5] = BLANK (), “2 Watchers”,
IF ( ‘Main Table’[Watchers_5] <> BLANK () && ‘Main Table’[Watchers_6] = BLANK (), “3 Watchers”,
IF ( ‘Main Table’[Watchers_6] <> BLANK () && ‘Main Table’[Watchers_7] = BLANK (), “4 Watchers”,
IF ( ‘Main Table’[Watchers_7] <> BLANK (), “5 Watchers”, BLANK () ))))))
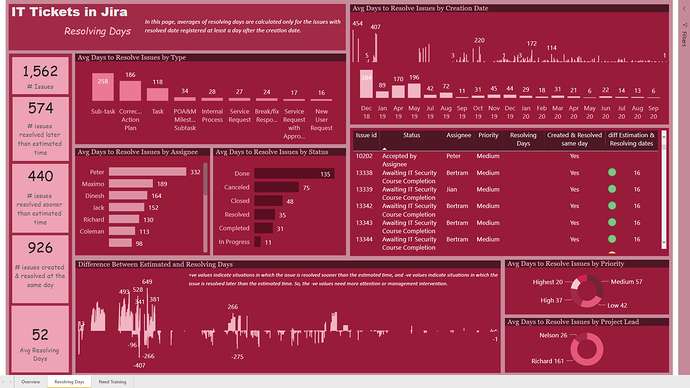
On this page, the graph showing the “Difference between Estimated and Resolution Dates” was so important to me, because I thought that maybe it can help the managers to find the problems with estimating the time an issue needed. I also used color circles in the table to categorize this measure into 3 different categories. If the estimated time was between (-30, +30), the color would be green, if it was greater than 30, the color would be yellow, and if it was less than -30, the color would be red.
Any feedback would be appreciated.
Best wishes
Hossein
Enterprise DNA Challenge 8th.pbix (288.4 KB)