Here’s Amdi’s entry for Power BI Challenge 8. @Amdi, would you like to share how you built this dashboard and what your inspiration is in building it?
Here is the link to the report:
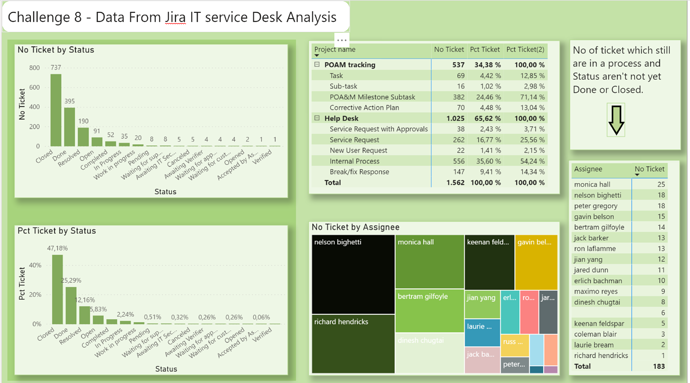
To learn about the real-life scenario presented for the challenge, be sure to click on the image below.

This post is part of the Enterprise DNA platform improvements, through the Data Challenge our members can now share how they built their dashboard and what their inspiration is in building it. We hope all members can utilize it efficiently.
Amdi, I’m seeing some great improvement from one challenge to the next. Really great to see you getting involved each and every time and I hope that you’re learning a lot and being inspired by other submissions that you’re seeing.
I like how you’ve looked to be a bit more descriptive in this particular reporting app. Where you have used some text around your visuals. Maybe you got this from Greg in his submissions but I’ve also taken some inspiration from this techniques inside of Power BI reports. I think it’s just as good being descriptive around what’s going on then just showing numbers and visuals.
I think overall the color palette works pretty well but with the tree map because you’ve got so many elements in it you’ve had to dive into colors that don’t work that well together in my view. Always try and make your colors as simple as possible and stick to a consistent palette everywhere. When you do that you can’t go wrong and it just makes your report look that much more compelling in my view.
Well done again and look forward to the next challenge and seeing what you produce.
Sam