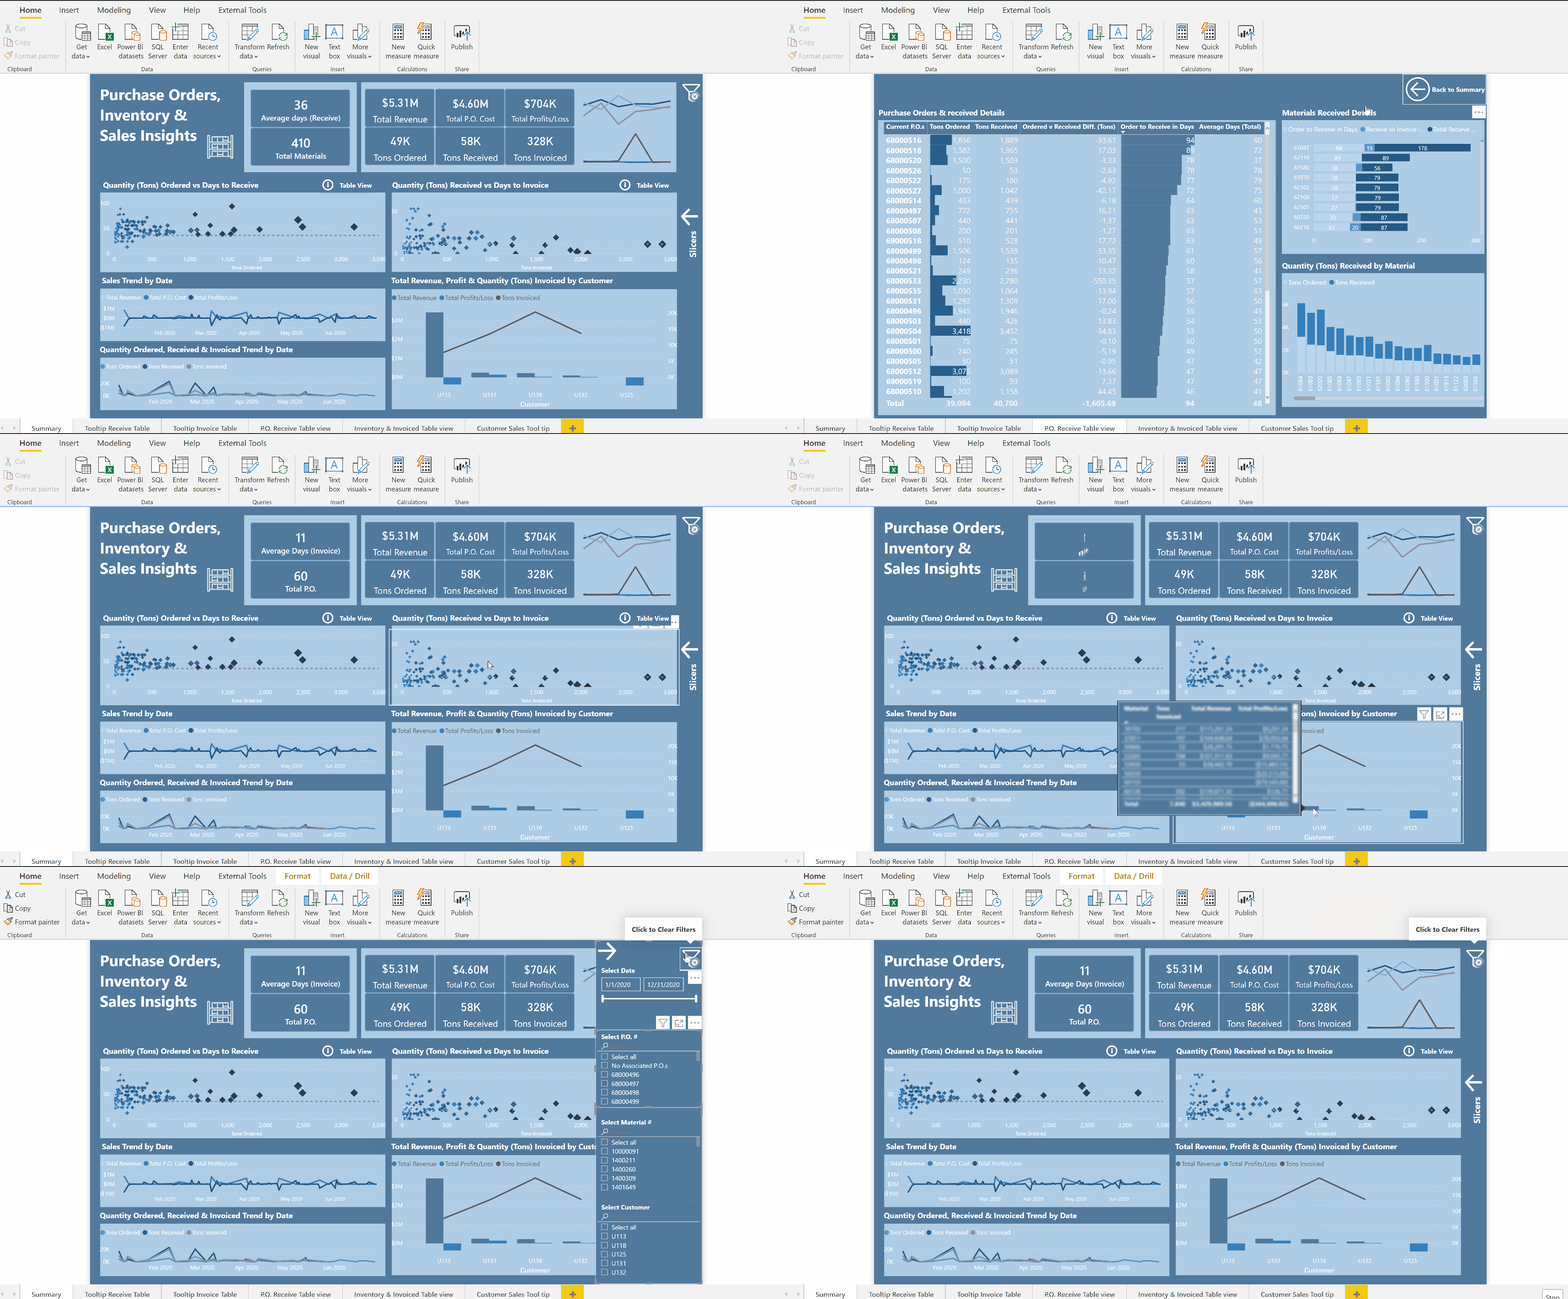
Here is @Neba’s entry for Power BI Challenge 7.
Details of the entry below:
Data Model:-
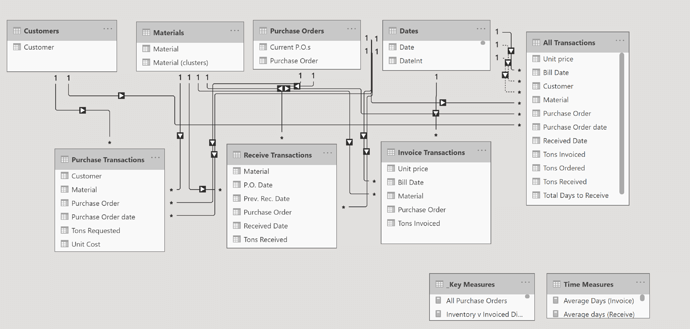
The challenging part for me was creating a Data Model that is efficient, and it took me awhile to come up with one that works well for the requirement.
I created the following three dimension tables and fact tables in Power Query :-
There are four dimension tables created after extracting distinct values of the Purchase Orders, Materials, Customers and a new Date table.
In order to create some of the calculations needed for this report, the three tables provided were merged using a left join starting with the biggest table which is invoices table in Power Query.
Visualizations:-
I created the visuals on this report after learning from my fellow participants on how to create a tool tip visual and some other techniques.
So thanks every one for the continuous learning experience I am having and for your support.

Here is the link to the report:
To learn about the real-life scenario presented for the challenge, be sure to click on the image below.

