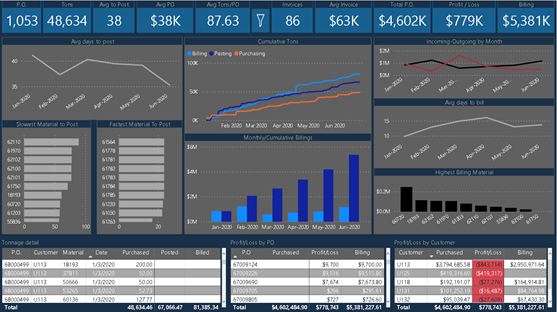
Here’s Mark’s entry for Power BI Challenge 7. @markperrone, feel free to add other details of your work.


Here’s how Mark described it:
DATA MODEL
Like others noticed PO and Material were in every table but also the customer because its tied to the PO. Where customer was not specified, I used “Unknown”. I cheated a little by creating the PO, Material, Customer table in another excel sheet. I could have done this with power query but if this were a database, I would have done this with SQL.
So, we have a conforming dimension which ties to all the fact tables (purchasing, receiving and billing) and lets us drill through across the different fact tables. We can use bidirectional relationships because there are no ambiguity issues, and we adhere to strict 1:M rules
I wanted to see how each fact progressed over time and since each fact has a date, I created an Activity fact, each date we see what happened across purchases, posting and billing.
The other activity was the days between each process – purchasing to posting, posting to billing along with the first/last date of each process – all this broken down by customer, PO and material. This is Activity 2 (didn’t take the time to come up with a better name for this table).
VISUALS
I concentrated primarily on the requirements but also considered “what would I want to see” and came up with the avg purchase-to-post visuals with the top & bottom 10 performers. I like to see KPI at the top, visuals next and finally some aggregated detail.
FILTERS
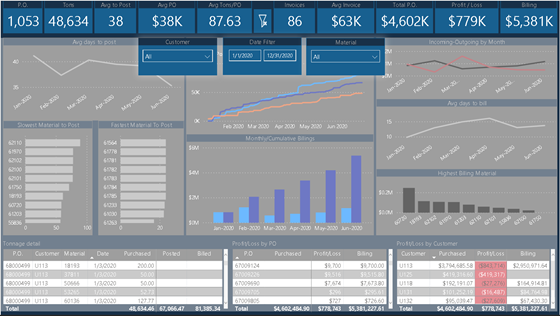
I implemented a pop-up filter to save screen real-estate. Straight-forward technique using bookmarks, selection pane and images. Here is the link to video https://www.youtube.com/watch?v=7OjY6bcyMg4 . This can also be done with buttons, but I thought the images were a little easier to work.
NOTE: I noticed there were 3 large spikes in the billing would have skewed some of the charts, so I suppressed them in the model.
OBSERVATIONS
Other than unknown, all customers were in the red.
VERSION 2 - I’ll be re-visiting this after checking out some other examples of business processes - cash flow, supply chain, etc.
To learn about the real-life scenario presented for the challenge, be sure to click on the image below.
