Here’s the entry from one of our non-member participants, Jihwan.
Here is the link to the report:
And here’s how Jihwan described It:
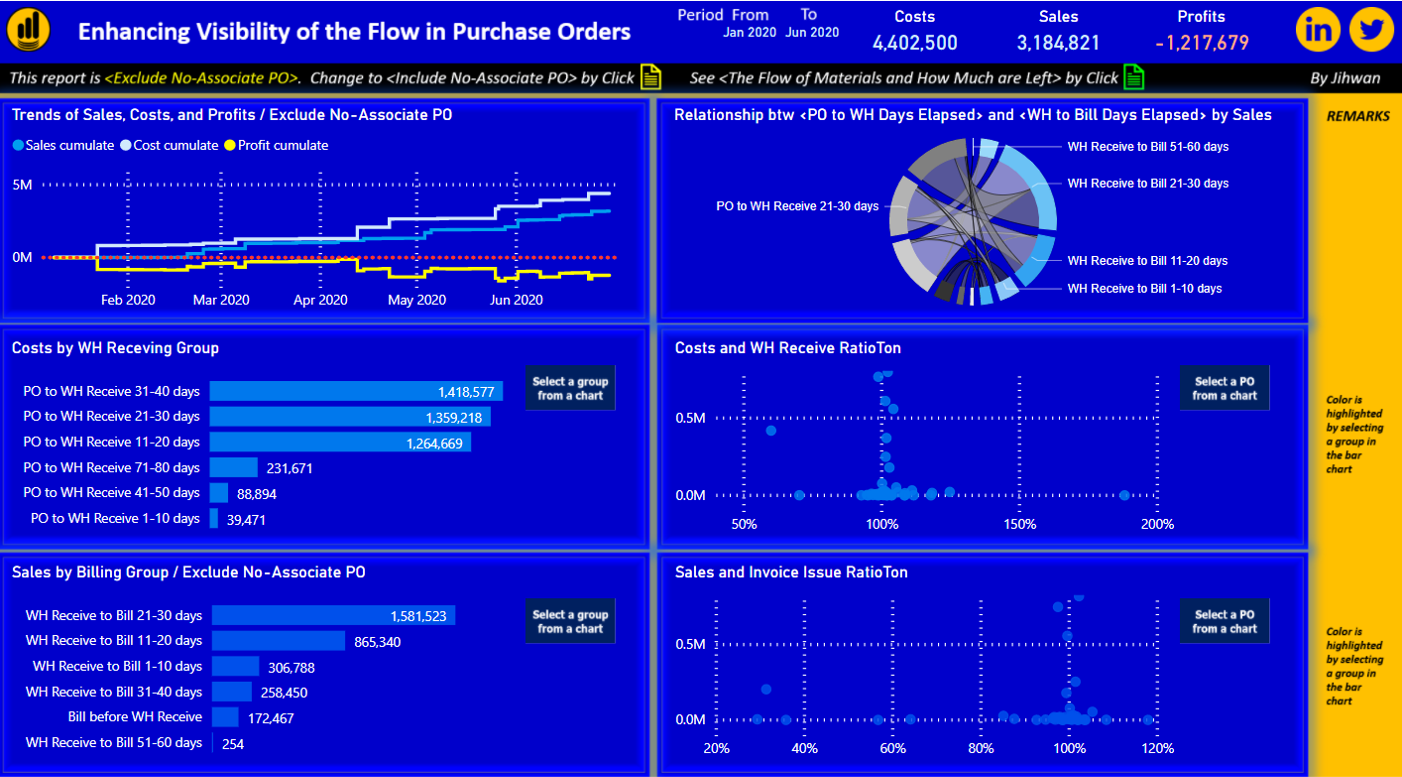
- Topic: Enhancing Visibility of the Flow in Purchase Orders
- Structure of the Report:
It visualizes Sales and Profits of the billings that are associate with Purchase Orders.
Costs are segmented by a group of days elapsed from PO-Date to First-Warehouse-Posting-Date.
By clicking each group in the bar chart, Purchase Orders are highlighted in the scatter chart.
Sales are segmented by a group of days elapsed from First-Warehouse-Posting-Date to First-Bill-Date.
By clicking each group in the bar chart, Purchase Orders are highlighted in the scatter chart.
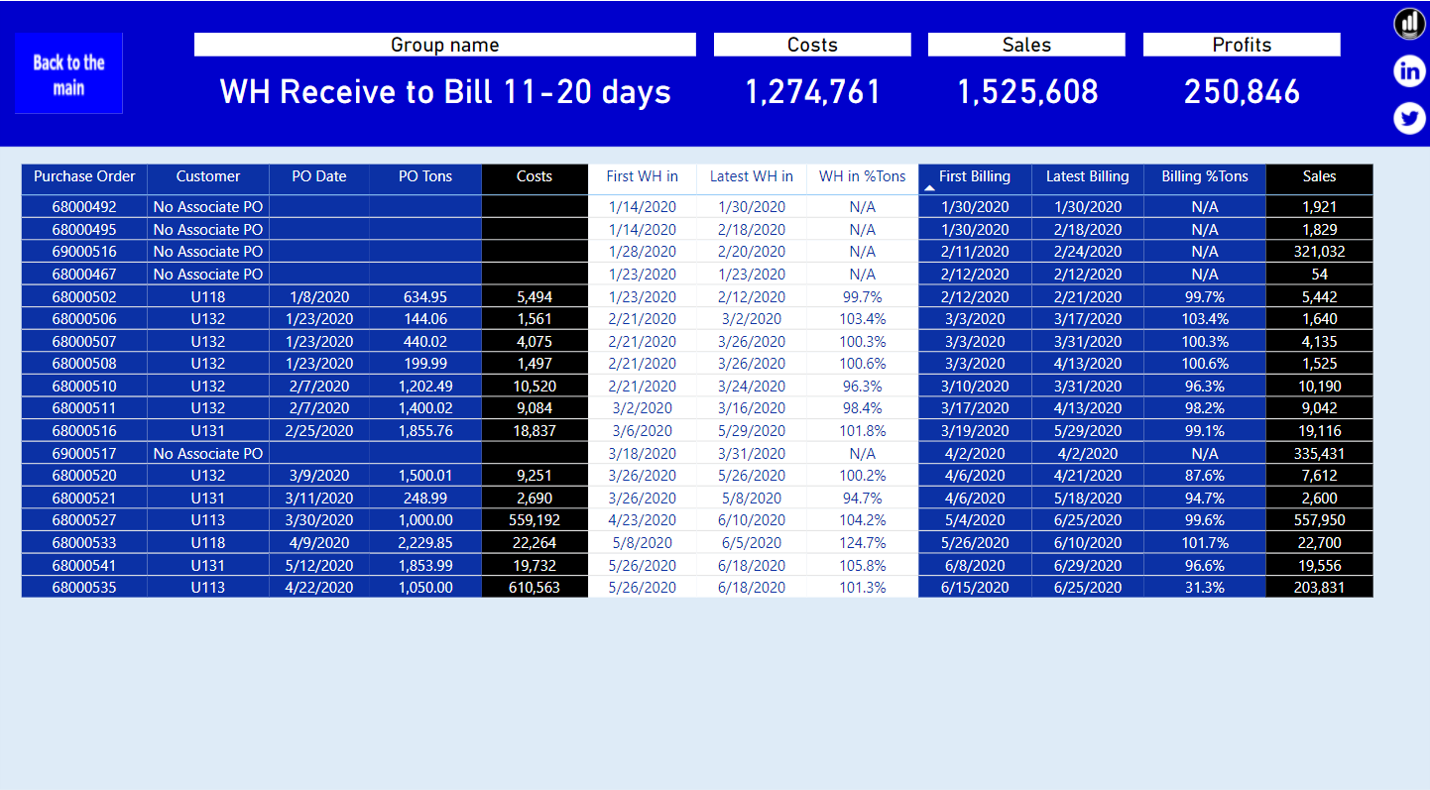
Each Bar chart can drill through to the detail page by selecting a group in the bar chart.
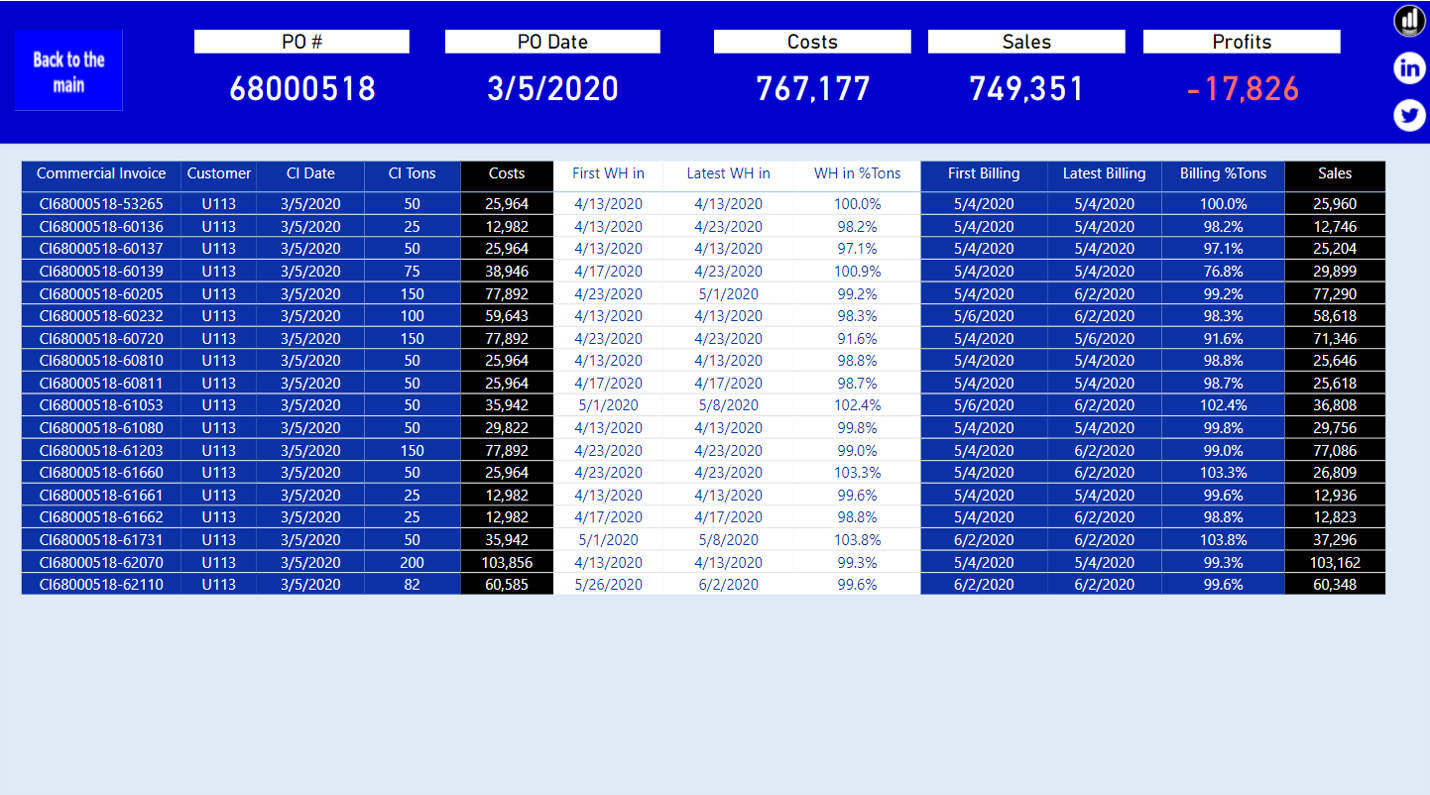
Each scatter-chart can drill through to the detail page by selecting a PO in the scatter chart.
Each visualization shows a tooltip box by hovering over.
In regards to the information that sales and profits are not associate with Purchase Orders, it is shown by clicking the image on the top-middle (yellow color image).
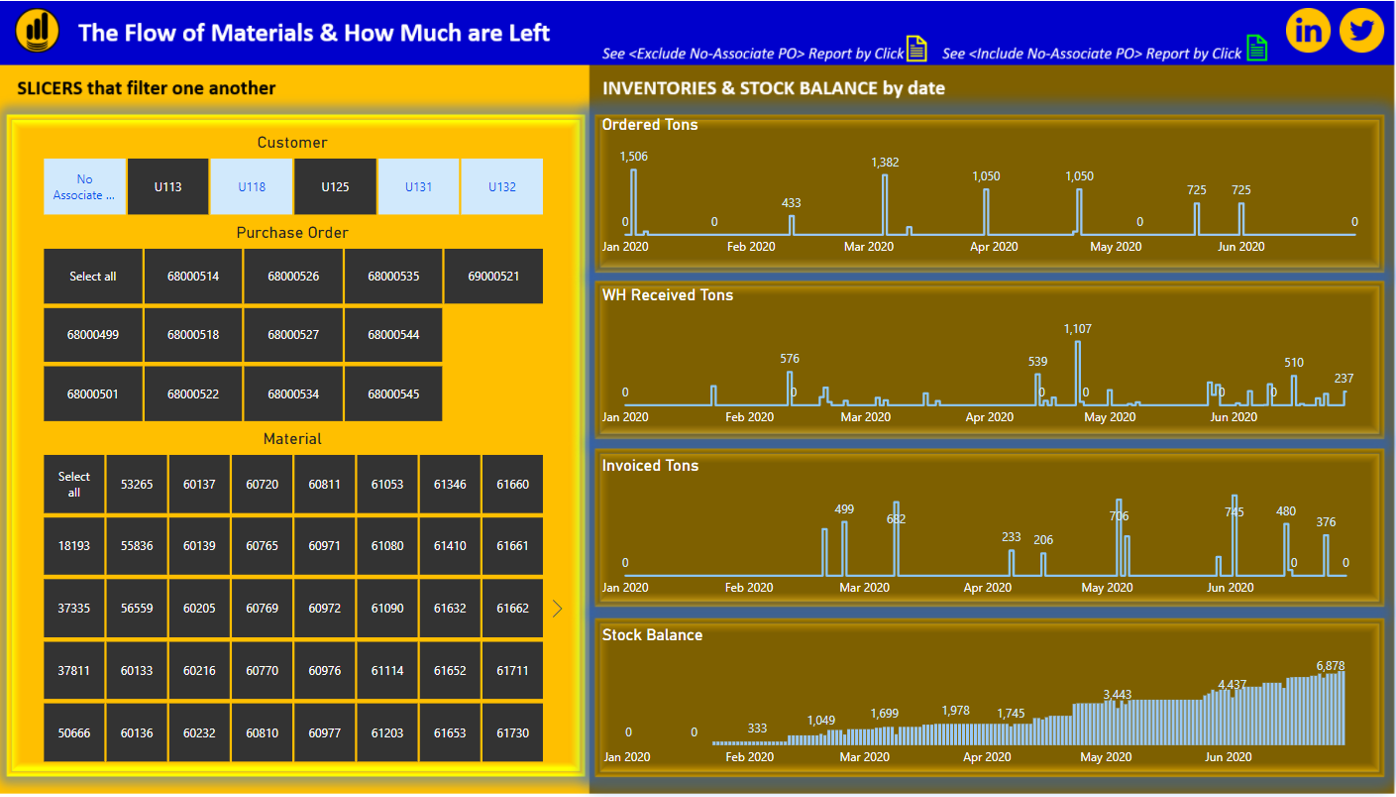
In regards to the information on the flow of inventory, it is shown by clicking the image on the top-right (green color image)
To learn about the real-life scenario presented for the challenge, be sure to click on the image below.
