There is not one single video that walks through this entire entry end-to-end, but there are a number of resources I and others have put together that will explain how to replicate the nonstandard elements of this entry.
The Data Model
I took a unique approach to modeling the data for this challenge, partially because it was a technique I’d used in a work project that provided a lot of analytical power and flexibility, and partially because it was the necessary structure needed to implement the timeline visual. I have a step-by-step writeup of my data modeling approach here:
Power BI Challenge 7 - Purchases, Inventory And Sales Entry from Brian J - #2 by BrianJ
The Timeline Visual and Custom Icons as Dynamic Indicators
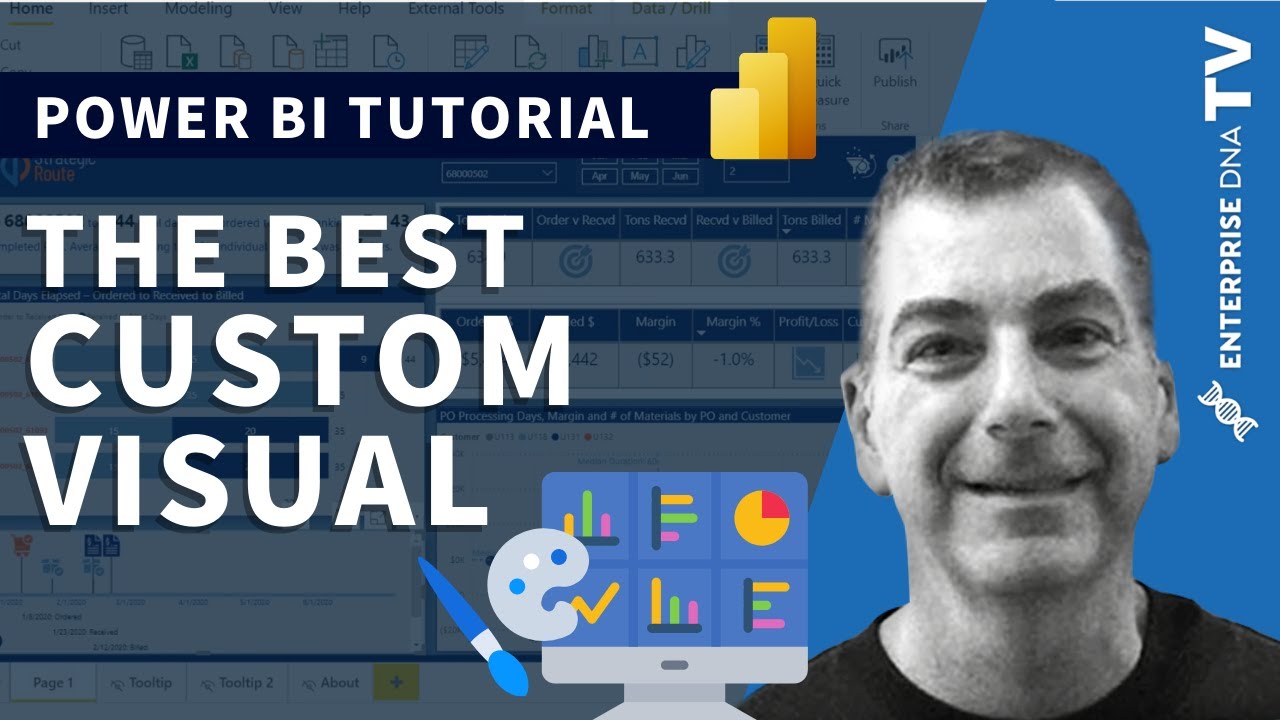
The timeline visual is kind of crazy, since it uses a really cool custom visual for which almost no documentation exists. To explain how to implement that visual, I created the video below. Another aspect of this entry is using custom icons as dynamic indicators (upper right portion of the report). While I don’t have a specific video addressing that, the process that I used to manipulate custom icons for the timeline visual is very similar to what I did for the indicators portion, and is discussed in the video below as well.
Also, re: the custom icons as indicators technique, you can refer to my writeup Challenge #5, where I discuss how that approach came out of an original failed attempt to incorporate the icons directly into the local file:
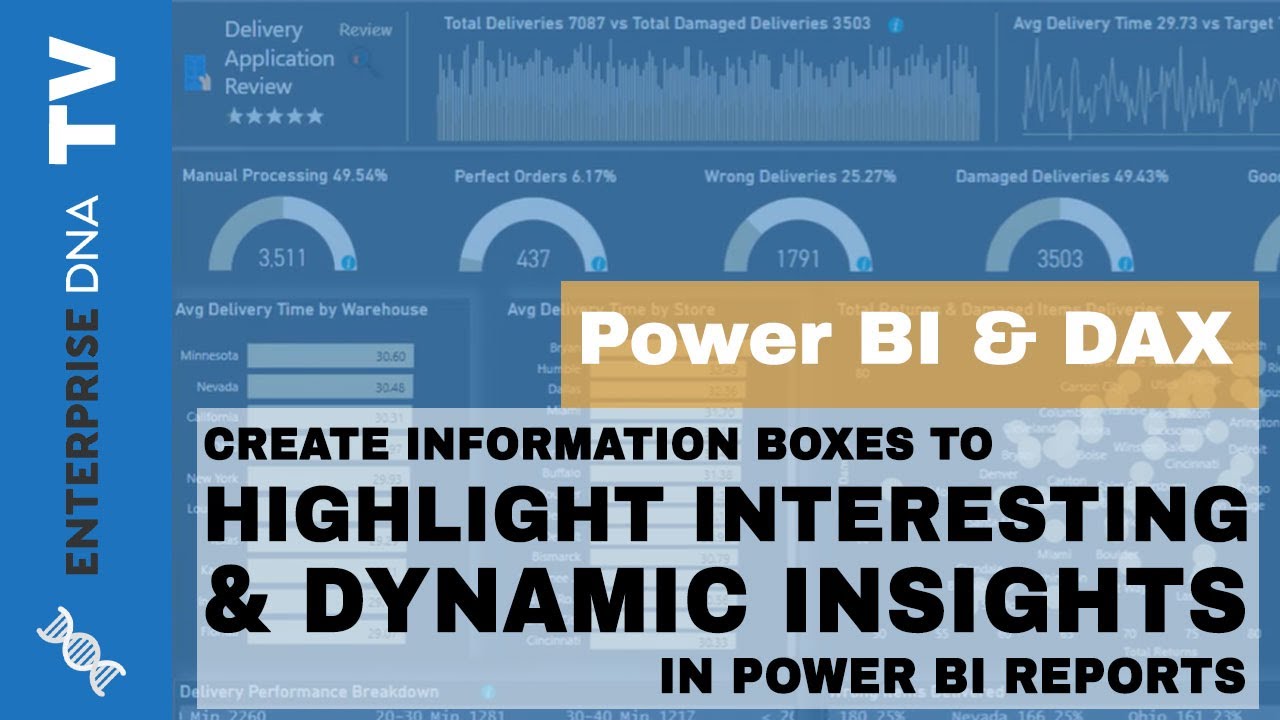
The Info Pop-Up for the Timeline Visual
This was a blatant steal of a technique I first saw used by @MudassirAli @sam.mckay did an excellent video dedicated to explaining this technique after Mudassir’s use of it in Data Challenge #4:
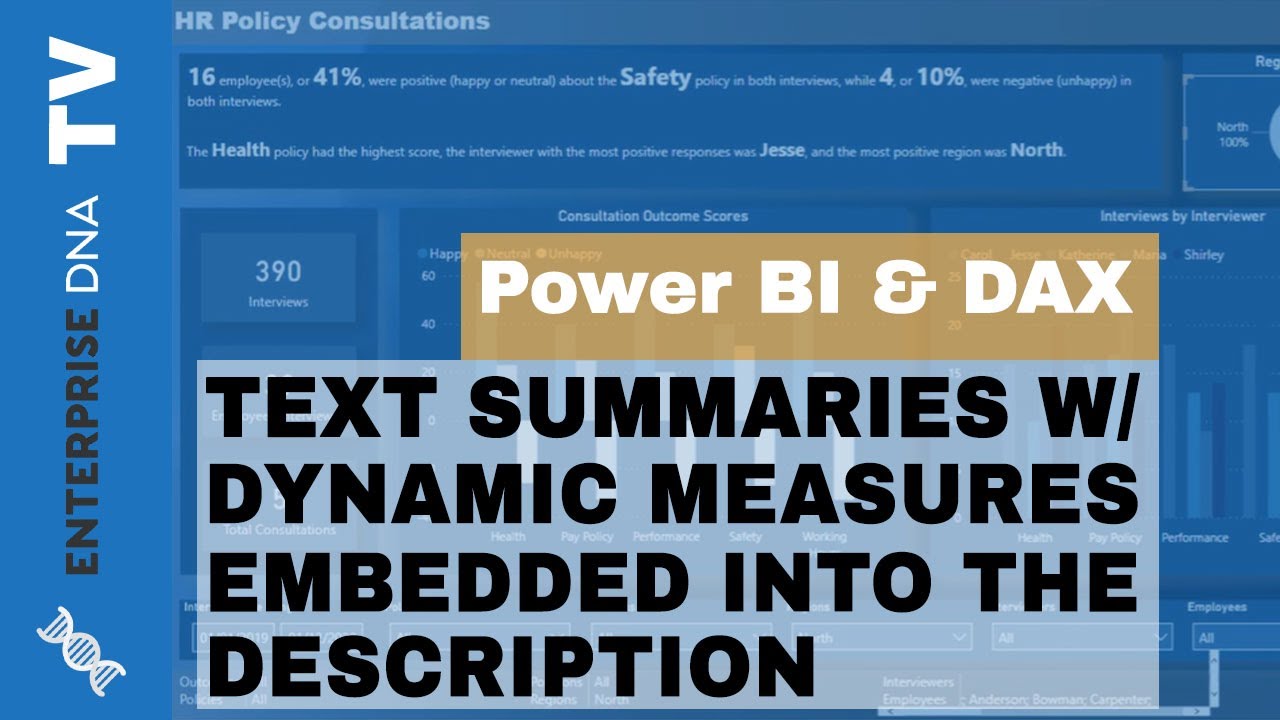
The Dynamic Text Narrative
This was another steal, this time from @Greg. Again, @sam.mckay did an excellent video on this approach. @Greg does absolutely epic writeups of his challenge entries, and has covered this one as well in a couple of his writeups. Here’s the link to Sam’s video on this technique
I think that should pretty much cover it. The rest of the techniques used in the report are fairly plain vanilla Power BI.
I hope this is helpful, and if after going through the resources above you still have any questions, just give me a shout. Thanks for your interest in this entry - I really had a lot of fun putting it together, so I hope you enjoy deconstructing and rebuilding it.
- Brian


