Here’s Amal’s entry for Power BI Challenge 7. @amal.rebai1995, feel free to add other details of your work.
Here’s how Amal described it:
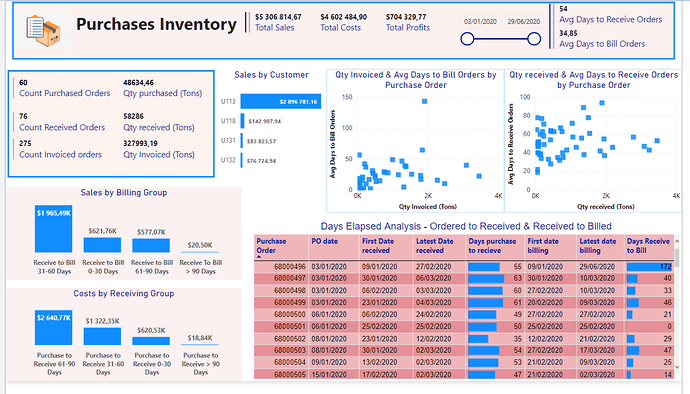
I displayed in cards: total sales, profits and costs, avg days taken to receive the orders & avg days taken to bill the orders.
Count purchased, received and invoiced orders and quantity purchased, received and invoiced.
I added a table to detail each order: the Purchase date, First and latest date Received, and the number of days between the order and the last entry.
Also I displayed the First date billed and latest date billed, and the number of days between the first entry at the warehouse and the last invoice date for each order.
To see tooltip for detailed materials by purchase order, hover over the visual tableau.
I created 2 scatter charts the first to show the average days taken to arrive a the Warehouse by PO compared to quantity sold the second to show the average days taken to bill the customers by PO compared to quantity invoiced.
I segmented the “purchase to receive period” into groups of days to display the costs for each period also for the “receive to bill period”, I divided it into groups to display the sales for each period.
To learn about the real-life scenario presented for the challenge, be sure to click on the image below.
