Great job @Neba. I love the part un Claims Status Analysis where you have shown status days in Matrix table. This is the part I could’t able to complete and still scratching my head to find the solution. Can you tell us how you did it?
Thank you for your feedback @MudassirAli, Of course I will share the DAX formula. I struggled to figure that out too to be honest, but I found a YouTube video on Curbal that explains how to calculate similar situations and shout out to @Greg he posted similar DAX formulas in the forum as well.
Here is the link to the video :-
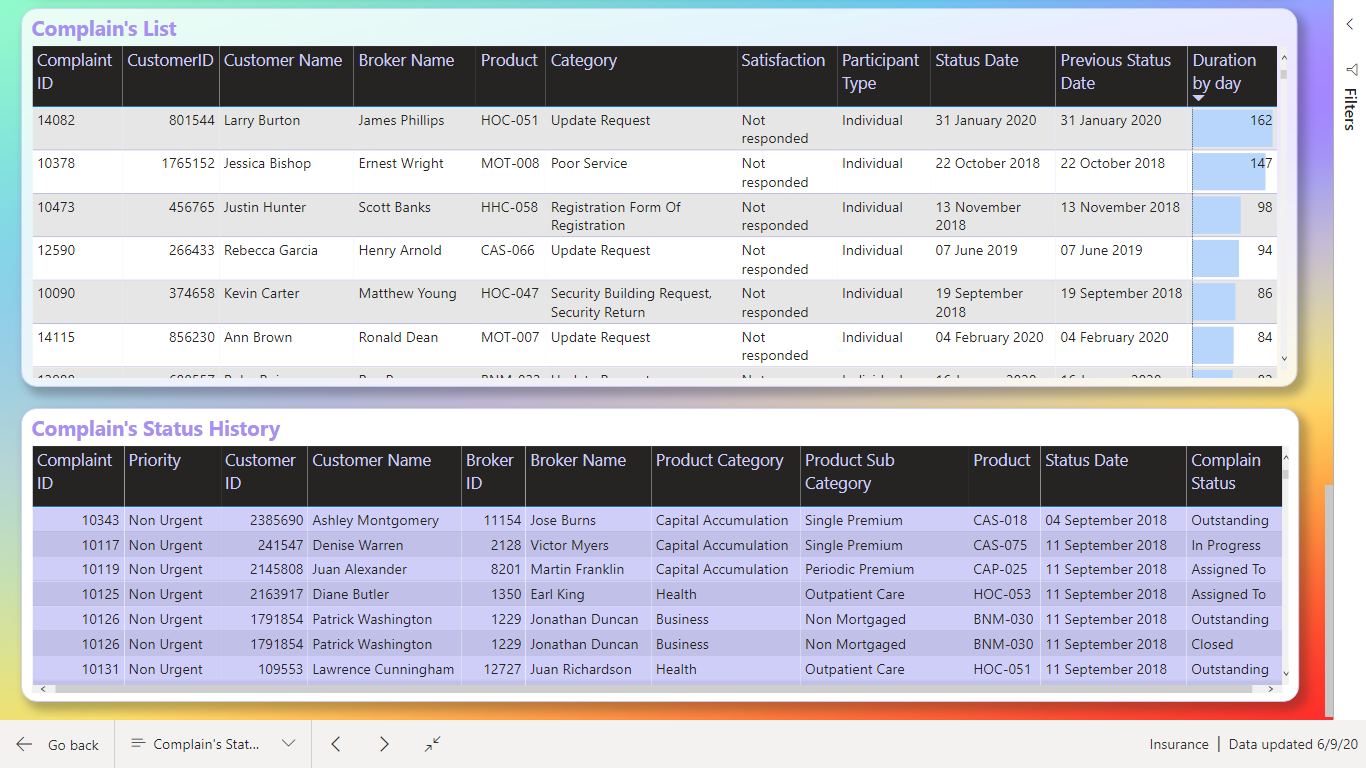
So, my understanding is there is a status id ( 1 - 9 ) column grouped by complain Id and date of the status update on the Status History table. Therefore, what I did was I created a calculated column that captures the day difference from previous row date and current row date for each complain Id Group and stamps it in a column.
The logic I used is :-
Diff. Current v Prev.s Dates =
VAR Mindate = CALCULATE( MIN( Complains[Complain Date] ) , ALLEXCEPT( Complains , Complains[ID] ) )
VAR Demoteddate =
            CALCULATE(
                MAX( 'Status History'[Status Date] ) ,
                FILTER(
                    ALLEXCEPT( 'Status History' , 'Status History'[Complaint ID] ) ,
                    'Status History'[Status Date] < EARLIER( 'Status History'[Status Date] ) ) )
RETURN
IF( 'Status History'[Status Date] = Mindate ,
        DATEDIFF( 'Status History'[Status Date] , 'Status History'[Status Date] , DAY ) ,
              DATEDIFF( Demoteddate , 'Status History'[Status Date] , DAY ) )
I used the Complains Fact table complain date as a starting date of the claim.
Then I used that calculated column to create following measure to concatenate the day numbers to " Days".
Status Progression by Day =

SWITCH( TRUE() ,
    CALCULATE( SUMX( (  'Status History' )  , 'Status History'[Diff. Current v Prev.s Dates] ),
        USERELATIONSHIP( 'Status History'[Complaint Status ID] , Statuses[ID] ) ) = BLANK()  , BLANK() ,
            CONCATENATE( CALCULATE( SUMX( (  'Status History' )  , 'Status History'[Diff. Current v Prev.s
                                           Dates] ),
                                   USERELATIONSHIP( 'Status History'[Complaint Status ID] , Statuses[ID] ) ) , " Days"
                    )

                     )
Hope that was clear.
Regards,
Nebiyu
3 Likes
@Neba Wow for the explanation. I was so frustrated and wasn’t happy with my report because i wasn’t able to generate insights in status claims as I couldn’t find the solution for this. I am going to give this a try and will let you know.
Thanks a lot again 
@MudassirAli No problem. You created an impressive report. I really like it.
1 Like
@Neba…The formula wasn’t the issue, it was the relationship . Now I have created a bridging table between Statuses & Status History to solve the issue. That was such the easy fix but didn’t click to me before. 
Challenge Participants,
Well… I had grand plans for my entry on this excellent challenge. My strategy was to use the challenge to explore some of the AI and machine learning capabilities of Power BI that I hadn’t previously delved deeply into. Here’s how I was planning to structure my entry:
- Fraud detection algorithms built in DAX and R to detect irregularities in the data based on Benford’s Law (based on a suggestion from @Paul)
- Analysis and visualization of status changes and when they happened using Synoptic Panel to transform a static process flow diagram into a dynamically linked visual that would depict status changes clearly and graphically
- Complaints broken down by dimensions using Microsoft Research’s Sand Dance visualization/ML interface.
- Worst offending brokers analyzed using Power BI Key Influencers visual
Here’s how it shook out: #1 I think was a big success, #2 was a partial fail – I learned a lot, ultimately got it to work but it ended up being a confusing visual that didn’t provide significant value or insight. In the right situation, I do think this is a good technique and you’ll probably end up seeing me use it down the road in another challenge. One that you will not see me use ever again is #3 Sand Dance. This section was an epic fail – I hated the interface and the look of the resulting visuals. #4 I think worked pretty well in terms of making what would be quite a complex analysis easily accomplished and accessible to even relatively new users. Given the failures on sections #2 and #3, I don’t have a complete entry to present, but thought some may find value in the explanation of #1 and #4, so here goes:
FRAUD DETECTION ALGORITHMS
Given that this challenge is about preparation for an audit, I thought focusing first on the reliability and validity of the data was a good starting point. Forensic accounting frequently uses Benford’s Law to detect irregularities in data that may be attributable to tampering/fraud. Benford’s Law states that:
“In many naturally occurring collections of numbers, the leading digit is likely to be small. For example, in sets that obey the law, the number 1 appears as the leading significant digit about 30% of the time, while 9 appears as the leading significant digit less than 5% of the time. If the digits were distributed uniformly, they would each occur about 11.1% of the time.” (Wikipedia)
Benford’s law has been shown to apply to series’as varied as transaction level accounting data, census data, home addresses, areas of lakes, stock prices, death rates, home prices, distances between planets, and a wide array of other types of data series.
For this challenge, I calculated using some virtual table-heavy DAX measures the frequency distribution of the first digits of the daily number of complaints, the expected reimbursement amounts and the population of the cities of the clients associated with each complaint. What I found is summarized in the visuals below, which compare the observed distribution of the first digits of each of the chosen fields versus expected distribution under Benford’s Law.
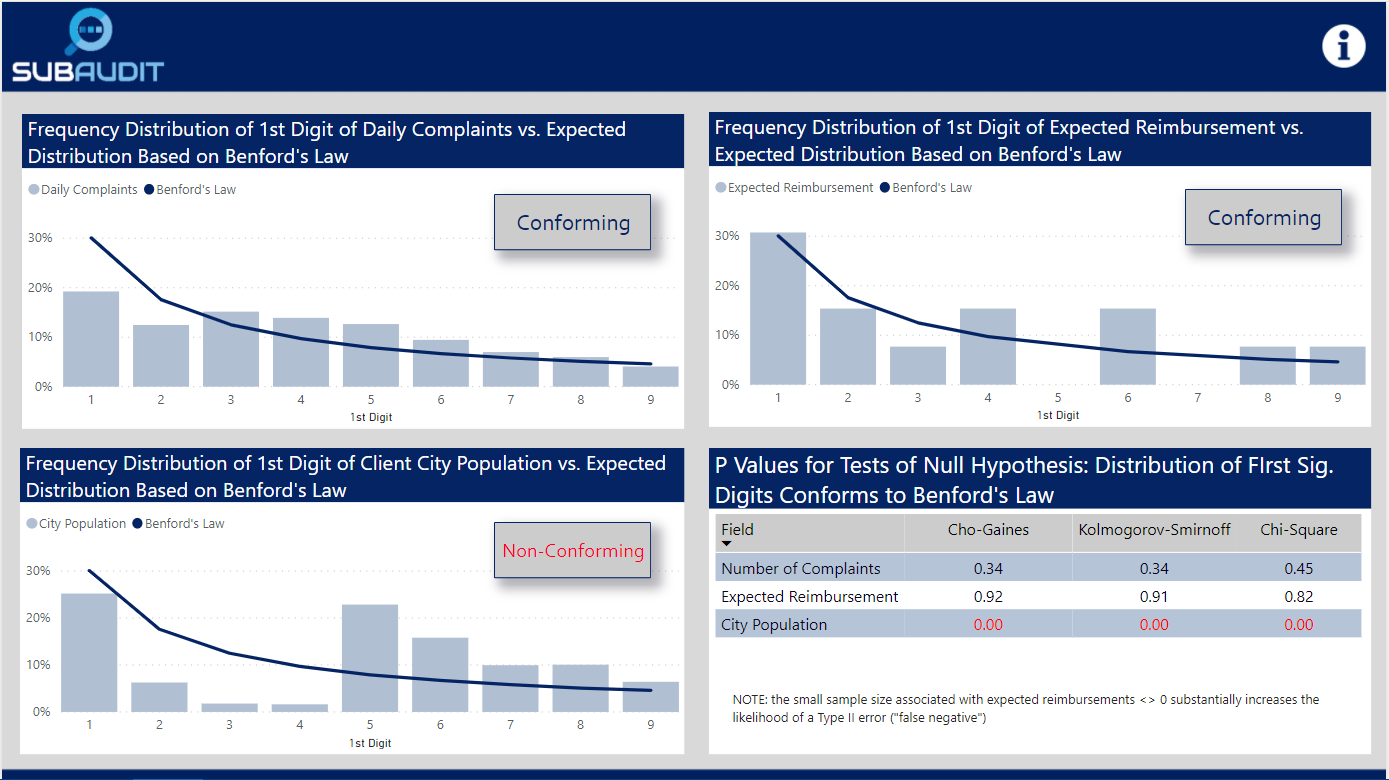
I then tested using the attached R script whether statistically the observed distribution conformed to the expected Benford distribution (note: this cannot be done reasonably within Power BI, because to generate the necessary P values to evaluate statistical significance you need to simulate 10,000 trials of this test. R can do this with just a few lines of code and almost instantaneously). In the case of complaints and expected reimbursements, the distributions did conform, while the distributions associated with city population did not. The first two results strongly imply that these data are real, not fabricated. The third result strongly indicates that this data either is fraudulent or has been randomly assigned to clients in a way that does not represent their actual locations and other attributes of the regional table. I groundtruthed these findings with @Haroonali1000, and he confirmed that my findings for all three were indeed correct.
This is a powerful technique that can be used in many different contexts to evaluate data quality.
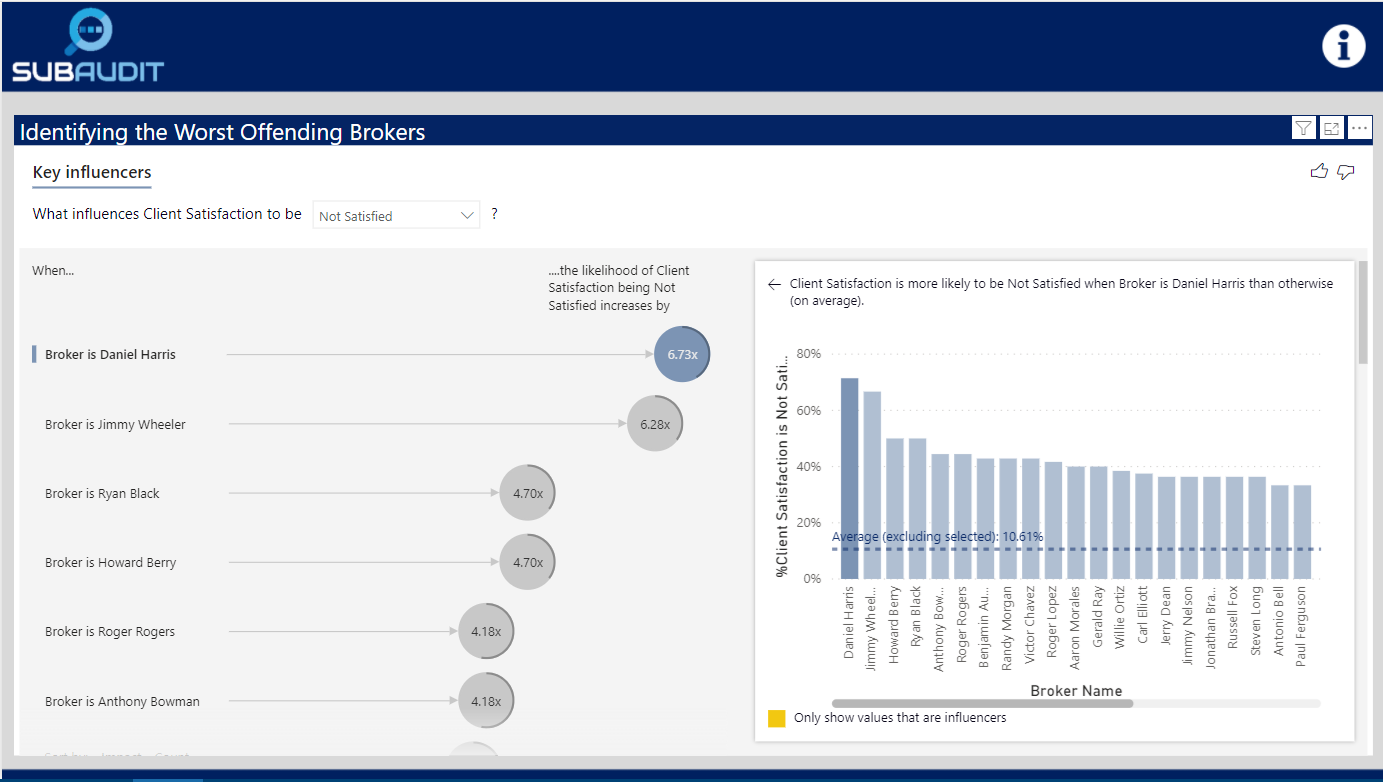
IDENTIFYING WORST-PERFORMING BROKERS USING KEY INFLUENCERS VISUAL
There are a lot of different ways one could define “worst performing” per the requirements of the brief. I thought the most direct way was to identify which brokers had the lowest levels of client satisfaction. To do this in a statistically rigorous way, one would typically need to build a multiple regression model. However, standard regression models won’t work if the outcome variable is categorical or in this case binary (satisfied versus not satisfied). To do that analysis you would typically need to employ a logistic regression model in R or a similar statistical package. However, Microsoft fairly recently incorporated the Key Influencers visual which easily does the heavy lifting of building the logistic regression model for you.
Simply by selecting the Key Influencers visual and dropping the right fields into the appropriate wells,
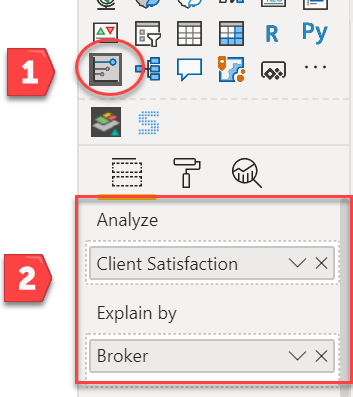
you get a fully interactive logistic regression visual that identifies the worst performing brokers:
By dropping down the outcome variable slicer, you can also quickly change the visual to show the best performing brokers.
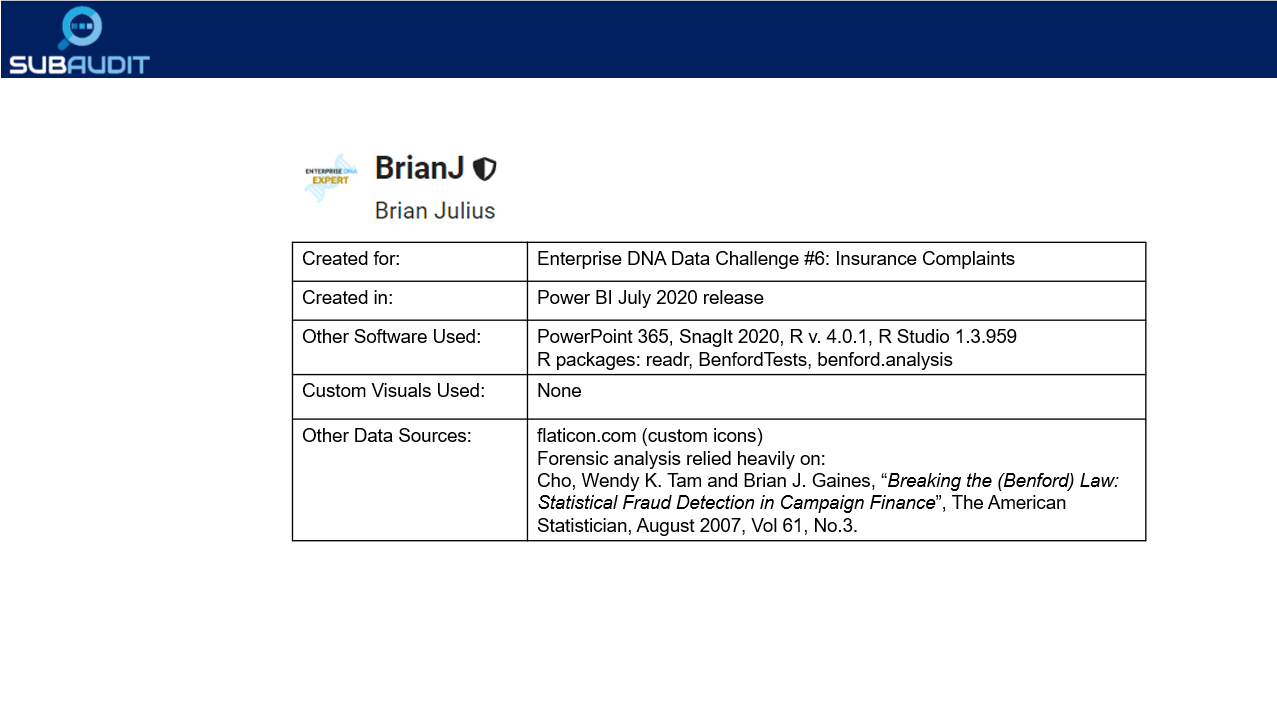
Anyway, disappointed that I don’t have a full entry to submit, but hope you found some value in what I learned through experimentation above. As I always do for my entries, here’s documentation of the tools I used to create the analyses above:
Hats off to the participants so far – all terrific entries, and I can’t wait to see what the rest of you have done with this challenge.
- Brian
PS – for those interested I’ve attached a copy of the R script that tests the distribution conformity.
Data Challenge 6.R (1.4 KB)
PPS - For those interested in learning more about the history and application of Benford’s Law, check out the Netflix series Connections, episode #4 entitled “Digits”. It’s a fascinating exploration of how Benford’s Law applies to finance and accounting, music, social media, photography, astronomy, voting patterns, etc.
14 Likes
@MudassirAli Oh I see. For me I created inactive relationship between Status and Status History tables and used USERELATIONSHIP function. I am glad it worked out though. looking forward to your Matrix or another visual you will use.
1 Like
@BrianJ I would just say that your skill set is very very unique and the above analysis has motivated me more to go for machine learning / data analytics expertise.
This is just unique. Hats Off!
1 Like
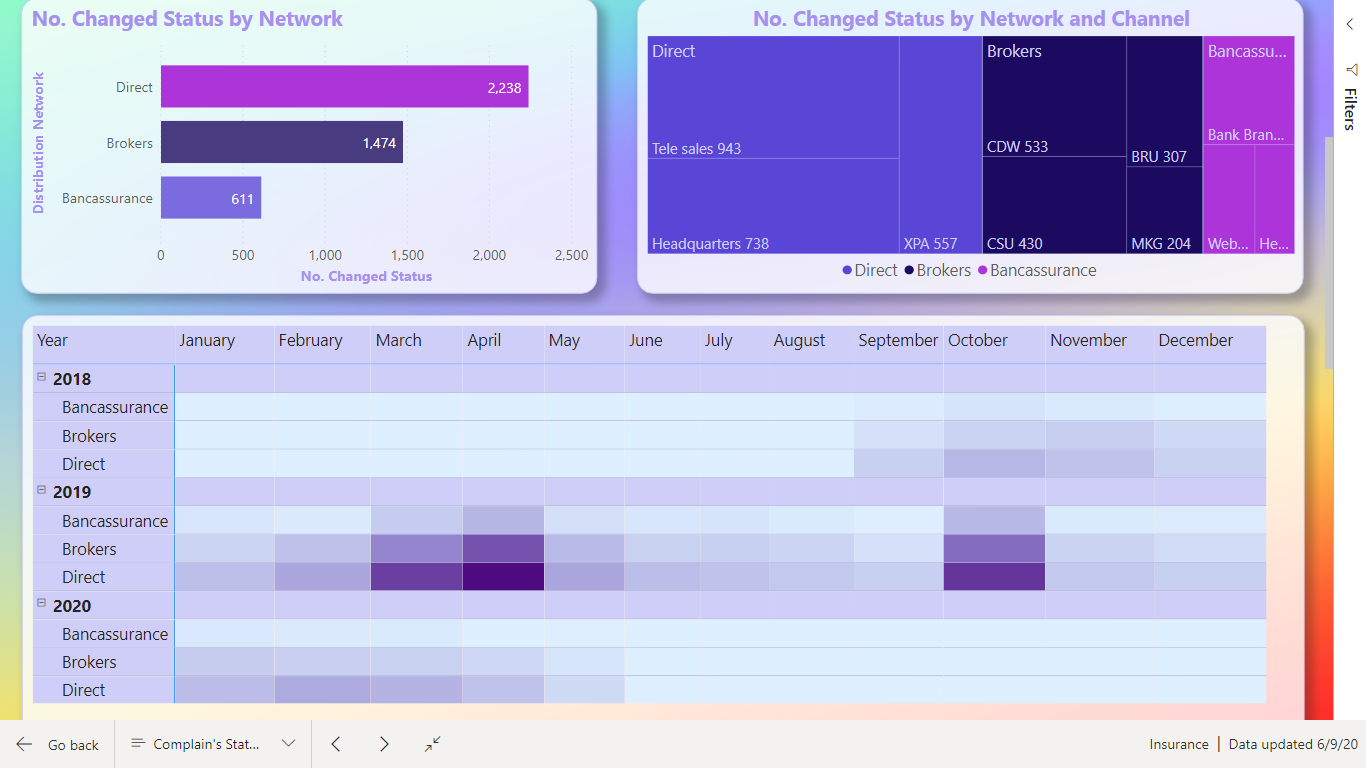
Terrific entry! Attractive design and color, well-organized according to the requirements of the brief, wide range of techniques utilized and a very nice job addressing the Status History data, which IMO was the most difficult aspect of this challenge. I think the heat map visual you used to depict the duration of the individual process steps was particularly effective.
The progress in your entries from Challenge #4 to Challenge #6, from both a design and analytics perspective is quite remarkable and should be an inspiration to everyone looking to learn and improve through these challenges.
One very minor suggestion – on your front page, I think the look could be improved with the use of some graphics/icons to represent each section instead of just the titles.
Well done!
- Brian
1 Like
Hey @BrianJ , Great explanation of your thought process. How is R to learn from scratch ? You are inspiring me to learn R or Python next after understanding DAX well off course.
Do I need math or statistics background to be able to understand it well ?
Every time I open your R scripts using R- Studio, it looks intimidating.
Thanks,
Nebiyu
1 Like
Thank you @BrianJ for your feedback, It means a lot. I am learning tremendously from other entries by you and the other masters of PBI.
Yes you are right the home page was an easy task compared to the others and it is the cover of the report so it could have been better.
I will improve it.
Regards,
Nebiyu
2 Likes
R is incredibly simple to learn. Literally, you can learn how to do the types of things I’ve been doing in my challenge entries in a couple of days. The R. Scripts may look intimidating, but they’re actually pretty simple- typically loading the libraries needed for whatever specialized analysis is the focus (in this case two Benford analysis packages), some simple data loading and handling routines, assignment of variables and then the statistical and plotting commands. The handling routines are pretty constant and the statistical commands you just can Google and fill in the blanks. The Challenges and forum work have put me behind on my videos, but I have one on beginning R for Power BI users that is almost done that I’ll try to finish up this weekend that shows how easy it actually is.
That being said, the key is having a good statistical foundation, since R makes it equally easy to run very good and very bad analyses. The are some great free training resources on line to build this necessary background, and if you’re interested I’d be glad to put together a list, similar to the one @Melissa did for M resources.
- Brian
3 Likes
Thank you for your reply. Good to know it’s not that hard and I am glad that there is a R Guru among us. Right now though, I still get stuck in some of the easy DAX calculations and I need to be able to use DAX comfortably before I move to another language. I am sure there are other members who mastered DAX and are ready for R. So when ever your ready to post it, please let us know.
Thanks,
Nebiyu
Far from an R Guru. Just someone with a good statistical background, who’s also good at Googling…

6 Likes
@BrianJ
still, you know if there are no doctors or internet in a small town a dude who goes to the city and googles the symptoms and gives a diagnosis is considered as a Doctor in that town? so it’s close enough
Thank God for google.
2 Likes
Thanks to @BrianJ, here is the link to the report:
1 Like
Hi everyone
My considerations
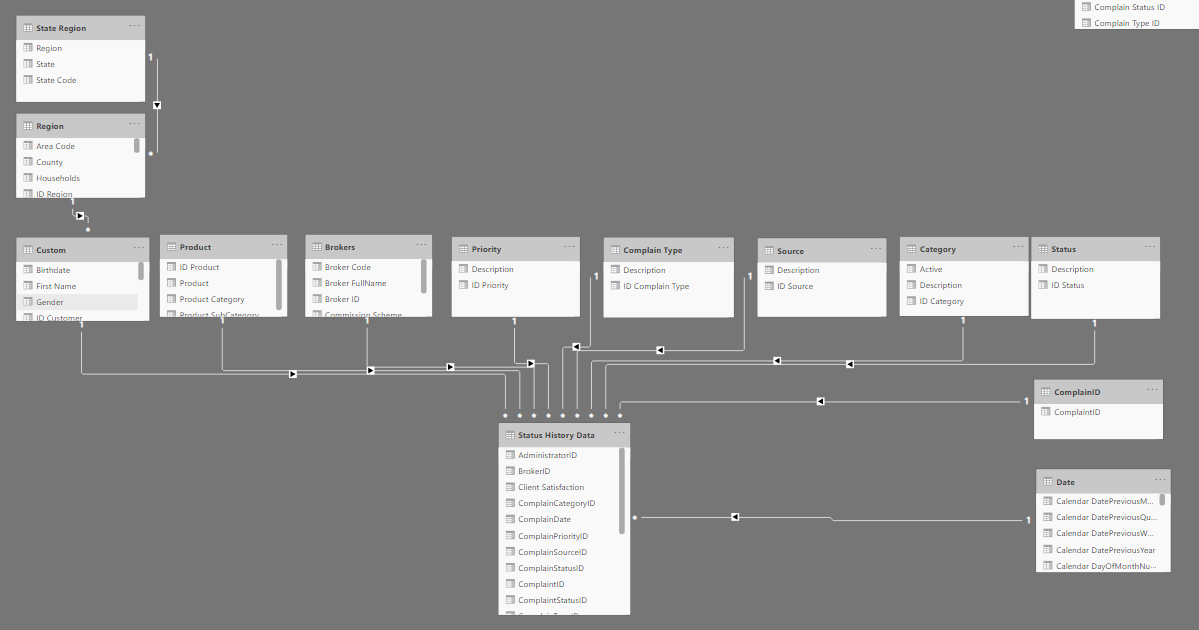
DATAMODEL
There was a lot of dimension. In the excel file from sheet Complaint Data I when through all the dimensions sheet to find which column could be linked to sheet Complaint Data.
Then I found that Sheet Regions and State Regions had connection to the customer and not Sheet Complain Data.
In the beginning of my process I thought the main Fact table was Complaint Data and the table Status History Data should have link to Table Complaint Data.
Afterwards I realize that all the dimensions from Complaint Data should be merge to Status History Data and table Status History Data had also record on claims which still where in process.
QUERY
The table Regions in some of the columns, had also Underscore between the words. I could handle it manually but looks in M code to see how this should be handled if there was a lot of tables with this issue. Because there was no function in Power query to handle this.
I came to this M-code.
“= Table.TransformColumnNames(#“Changed Type”,each if Text.Contains(,"“)
then Text.Replace(,"”," ") else _)”.
This M-code look for the Underscore and if not, it leaves the column.
There was a function to change word where, so the first word starts with Capital letter. I used that afterwards on column name.
MEASURES AND CALCULATED COLUMNS
I did only make one measure it was DISTINCTCOUNT to count number of claims.
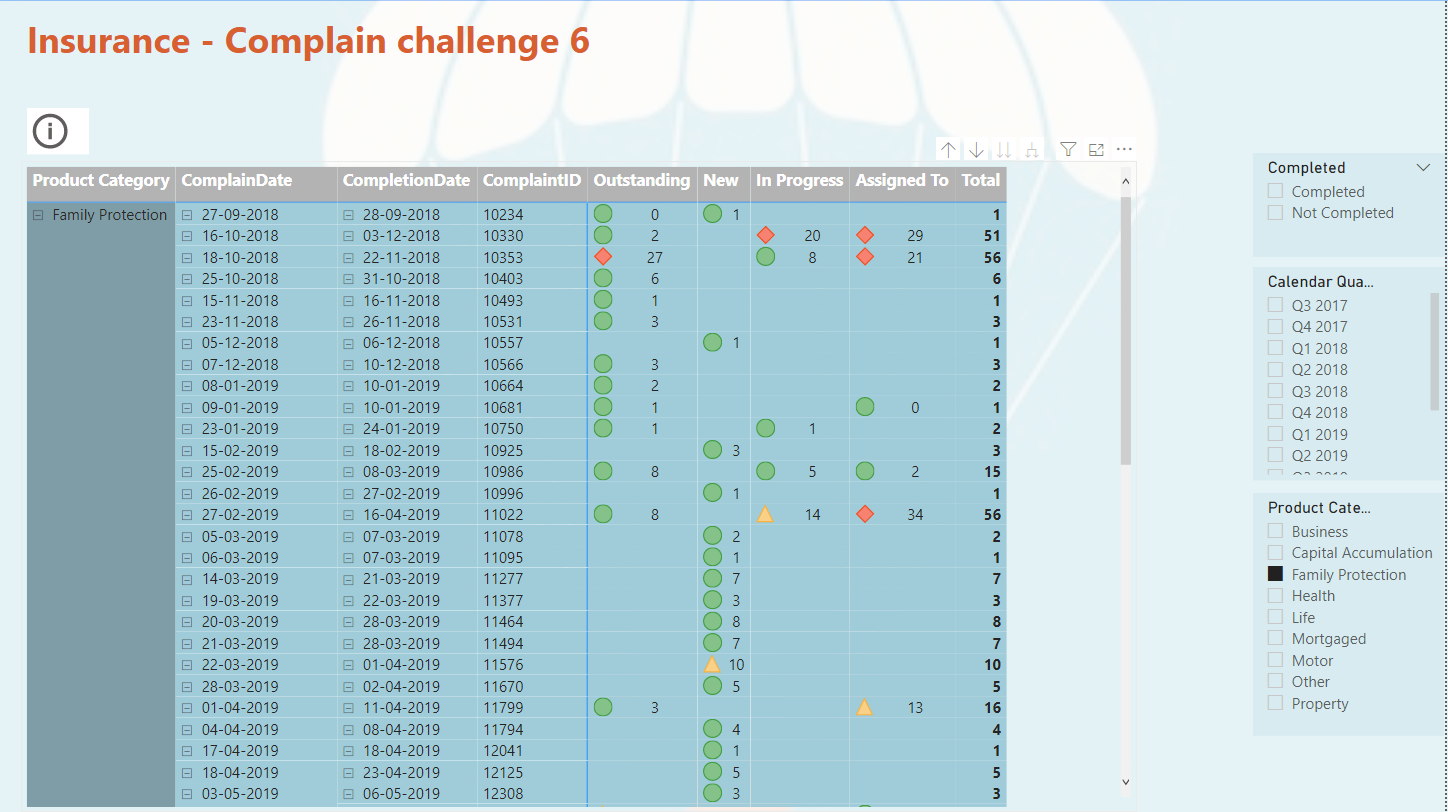
What I found interesting was to show how many days a claim was in each status. In last challenge 5 with eyes I would also like to calculate how much have the ex. Left eyes change from last time. Could not solve that.
This time I solved it. Each claim has many records for each status and a date for when the claim started the new status. I had to Range each claimID limited to the each ClaimID. Afterwards calculate the dates between to days. So, Rank 1 Status Start days 2019-01-15 and Rank 2 Status Start days 2019-01-20. So, Rank 1 status has then been on its status up to the day where Rank 2 status get its start date.
Remembered that I have read something about this issue. Now I found it SQLBI.COM. I used RANK as calculate column and then LOOKUPVALUE as calculate column. The calculated columns is placed in table Status History Data.
There is one issue. If the user gives a claim two different status on the same date. So, Rank 1 have two different status and up to Rank 2 the days will be counted twice.
I would say this could be an issue for the Internal Audit , as it should not be allowed. If change status on a date where it already has a status. The right way should be changing the status on an already record on the date.
I also decided that below 1o days in one status was fine. < 10 Green, < 20 Yellow, >= Red.
VISUALIZATION
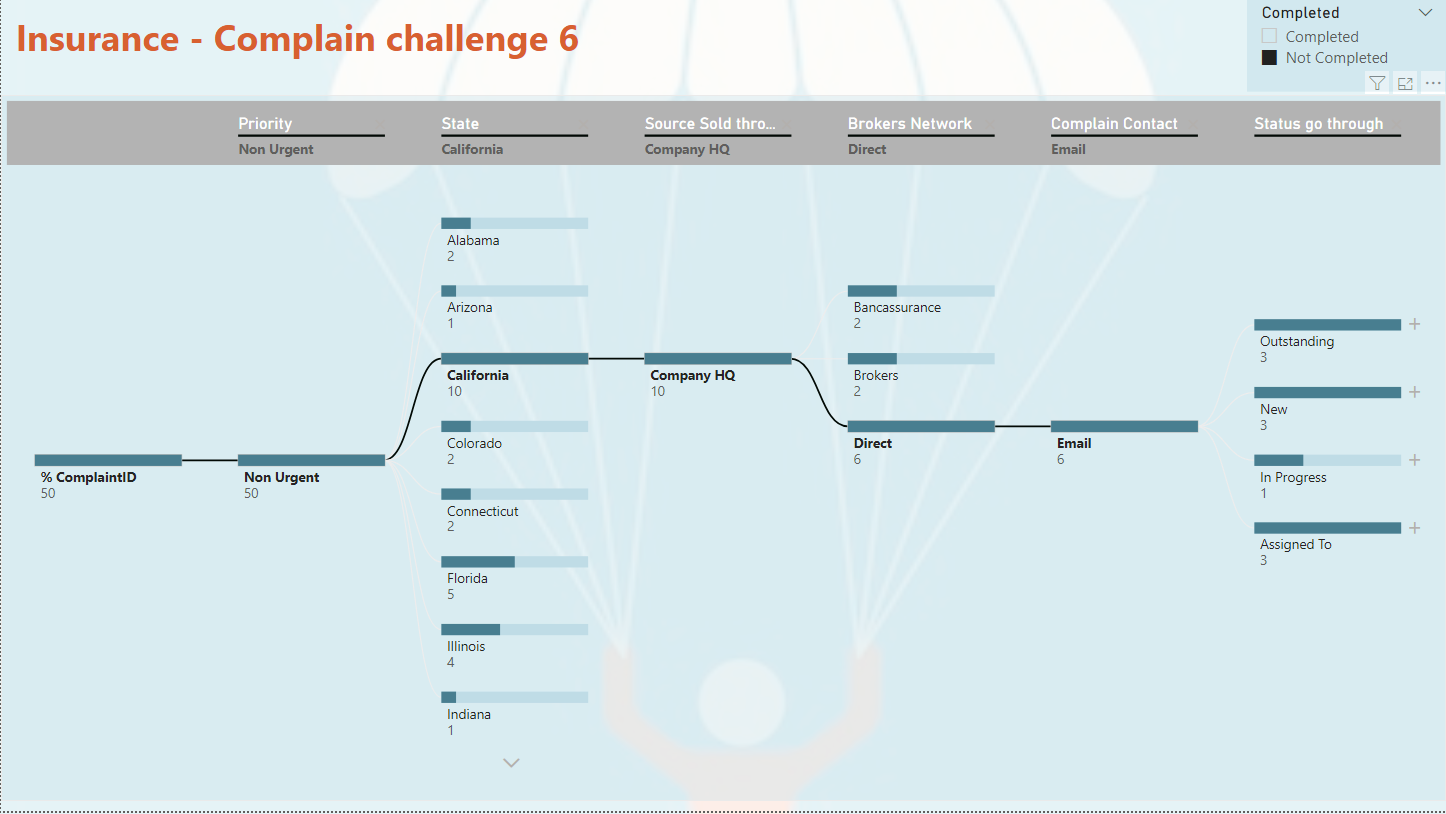
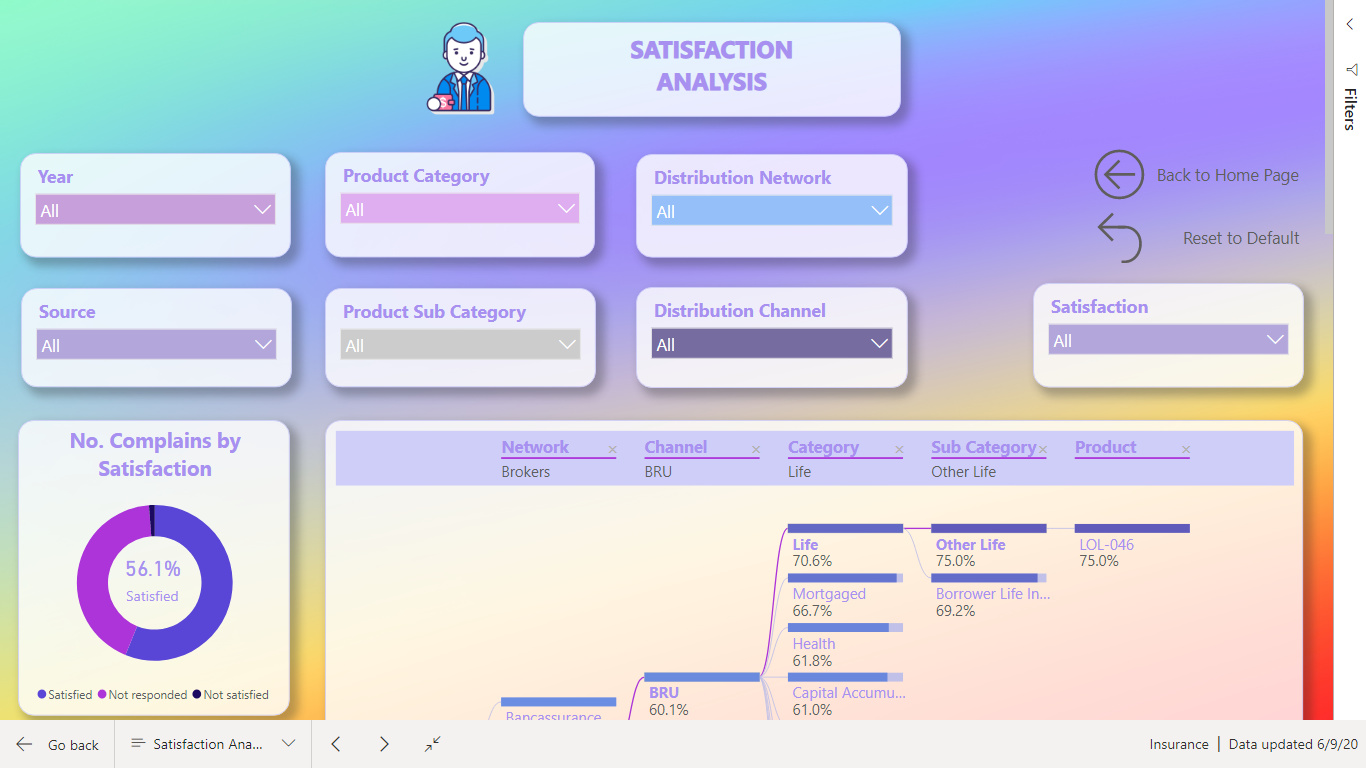
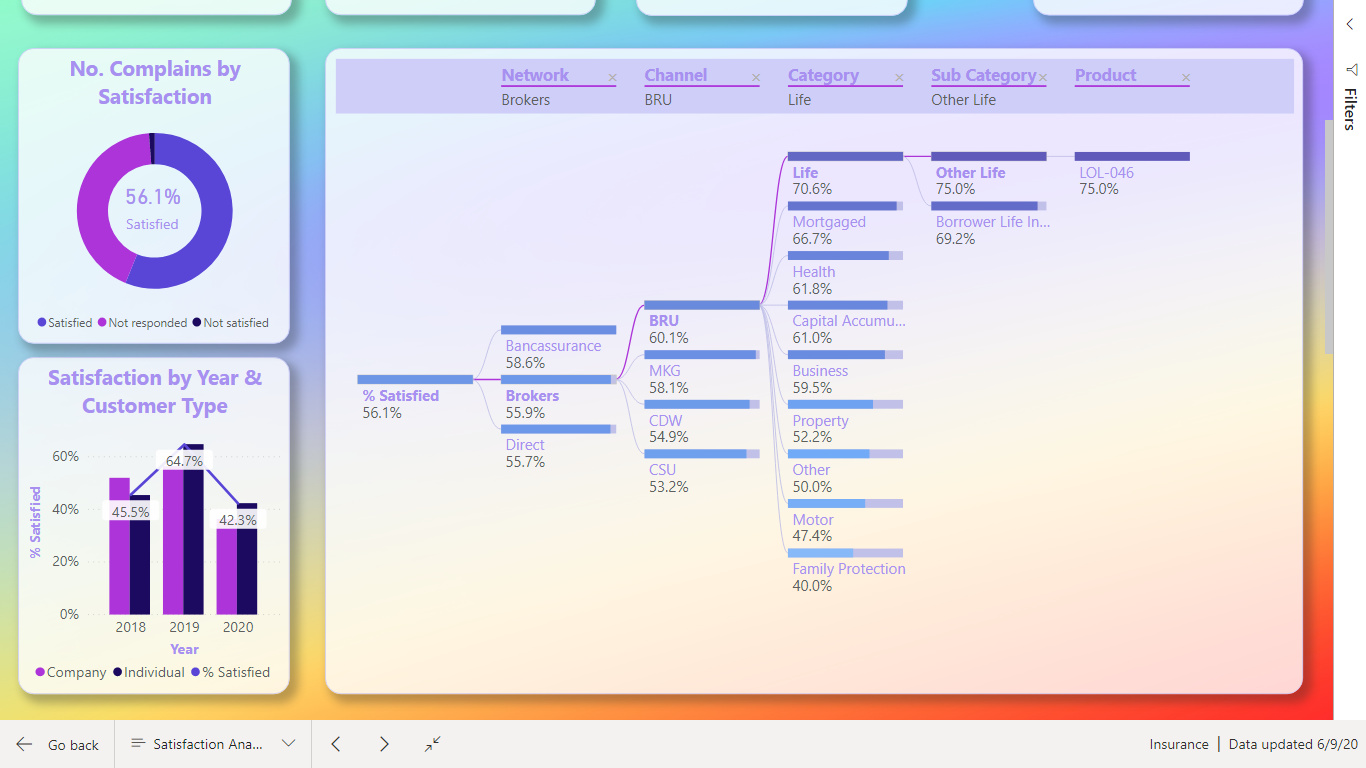
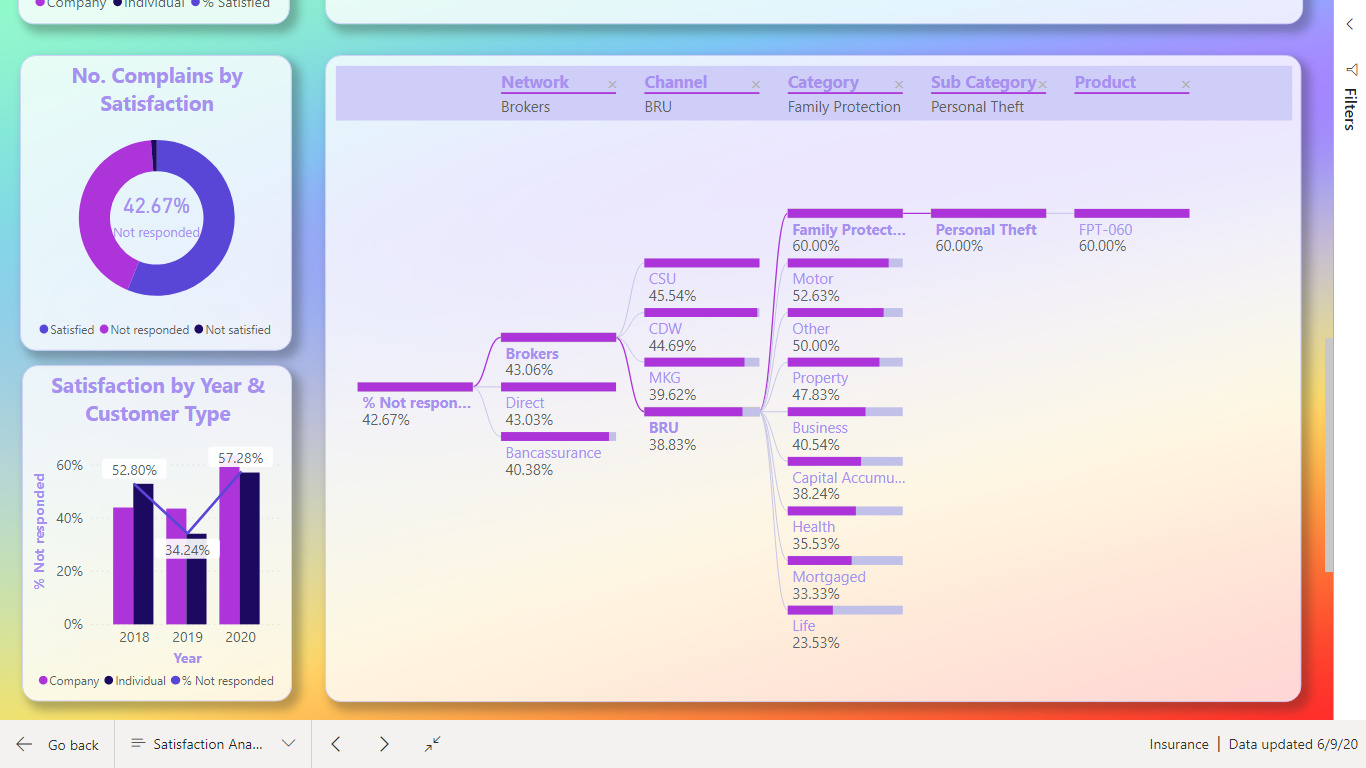
One factor we should consider was “Complaints broken down by the dimensions”. I find there was so many dimensions and not all I know what means.
I decided to show this as a Decomposition Tree Visualization, so the user can decide what to look at.
INSPIRATION
This time I did not see in challenge 6 to get in inspired.
Now I look forward to being inspired.
Challenge 6 - Insurance Complaints Data Amdi Silword.pbix (1.7 MB)
(upload://obPdeb9RZ0e46hd8uUAlp2appMm.pbix) (1.7 MB)
10 Likes
1 Like
Have a good day everyone, ![]()
Here is my submission for this challenge.


https://drive.google.com/file/d/1VITQoLF8la9w3bRj9XXjJUFeMoOYIPa9/view?usp=sharing
Thanks & Best Regards
Nhat Lam
7 Likes
Hello all,
Please find below my entry for the Challenge number 6. I went for a different approach for this challenge.
I wanted to try out some new ideas and techniques and also concentrate on the message to transmit.
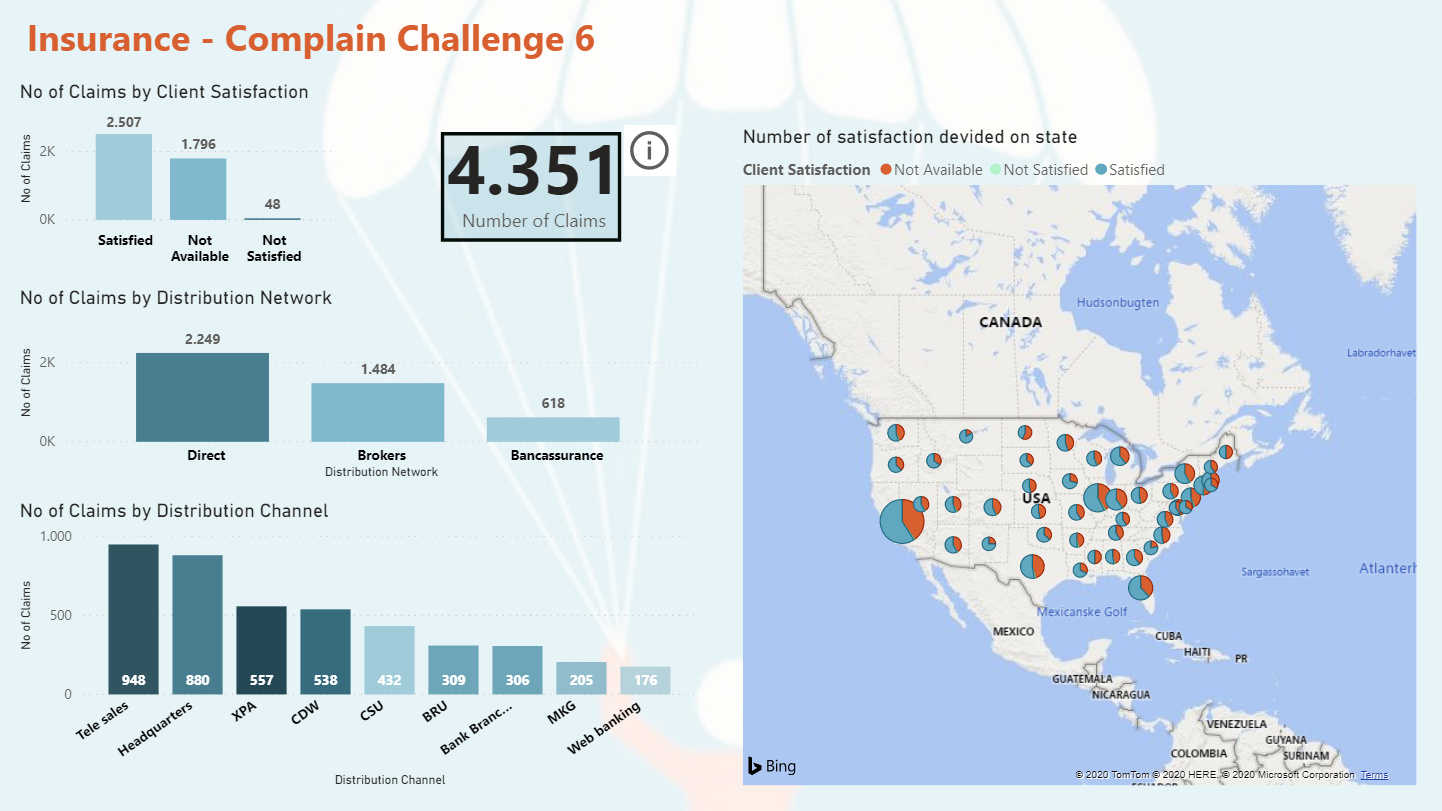
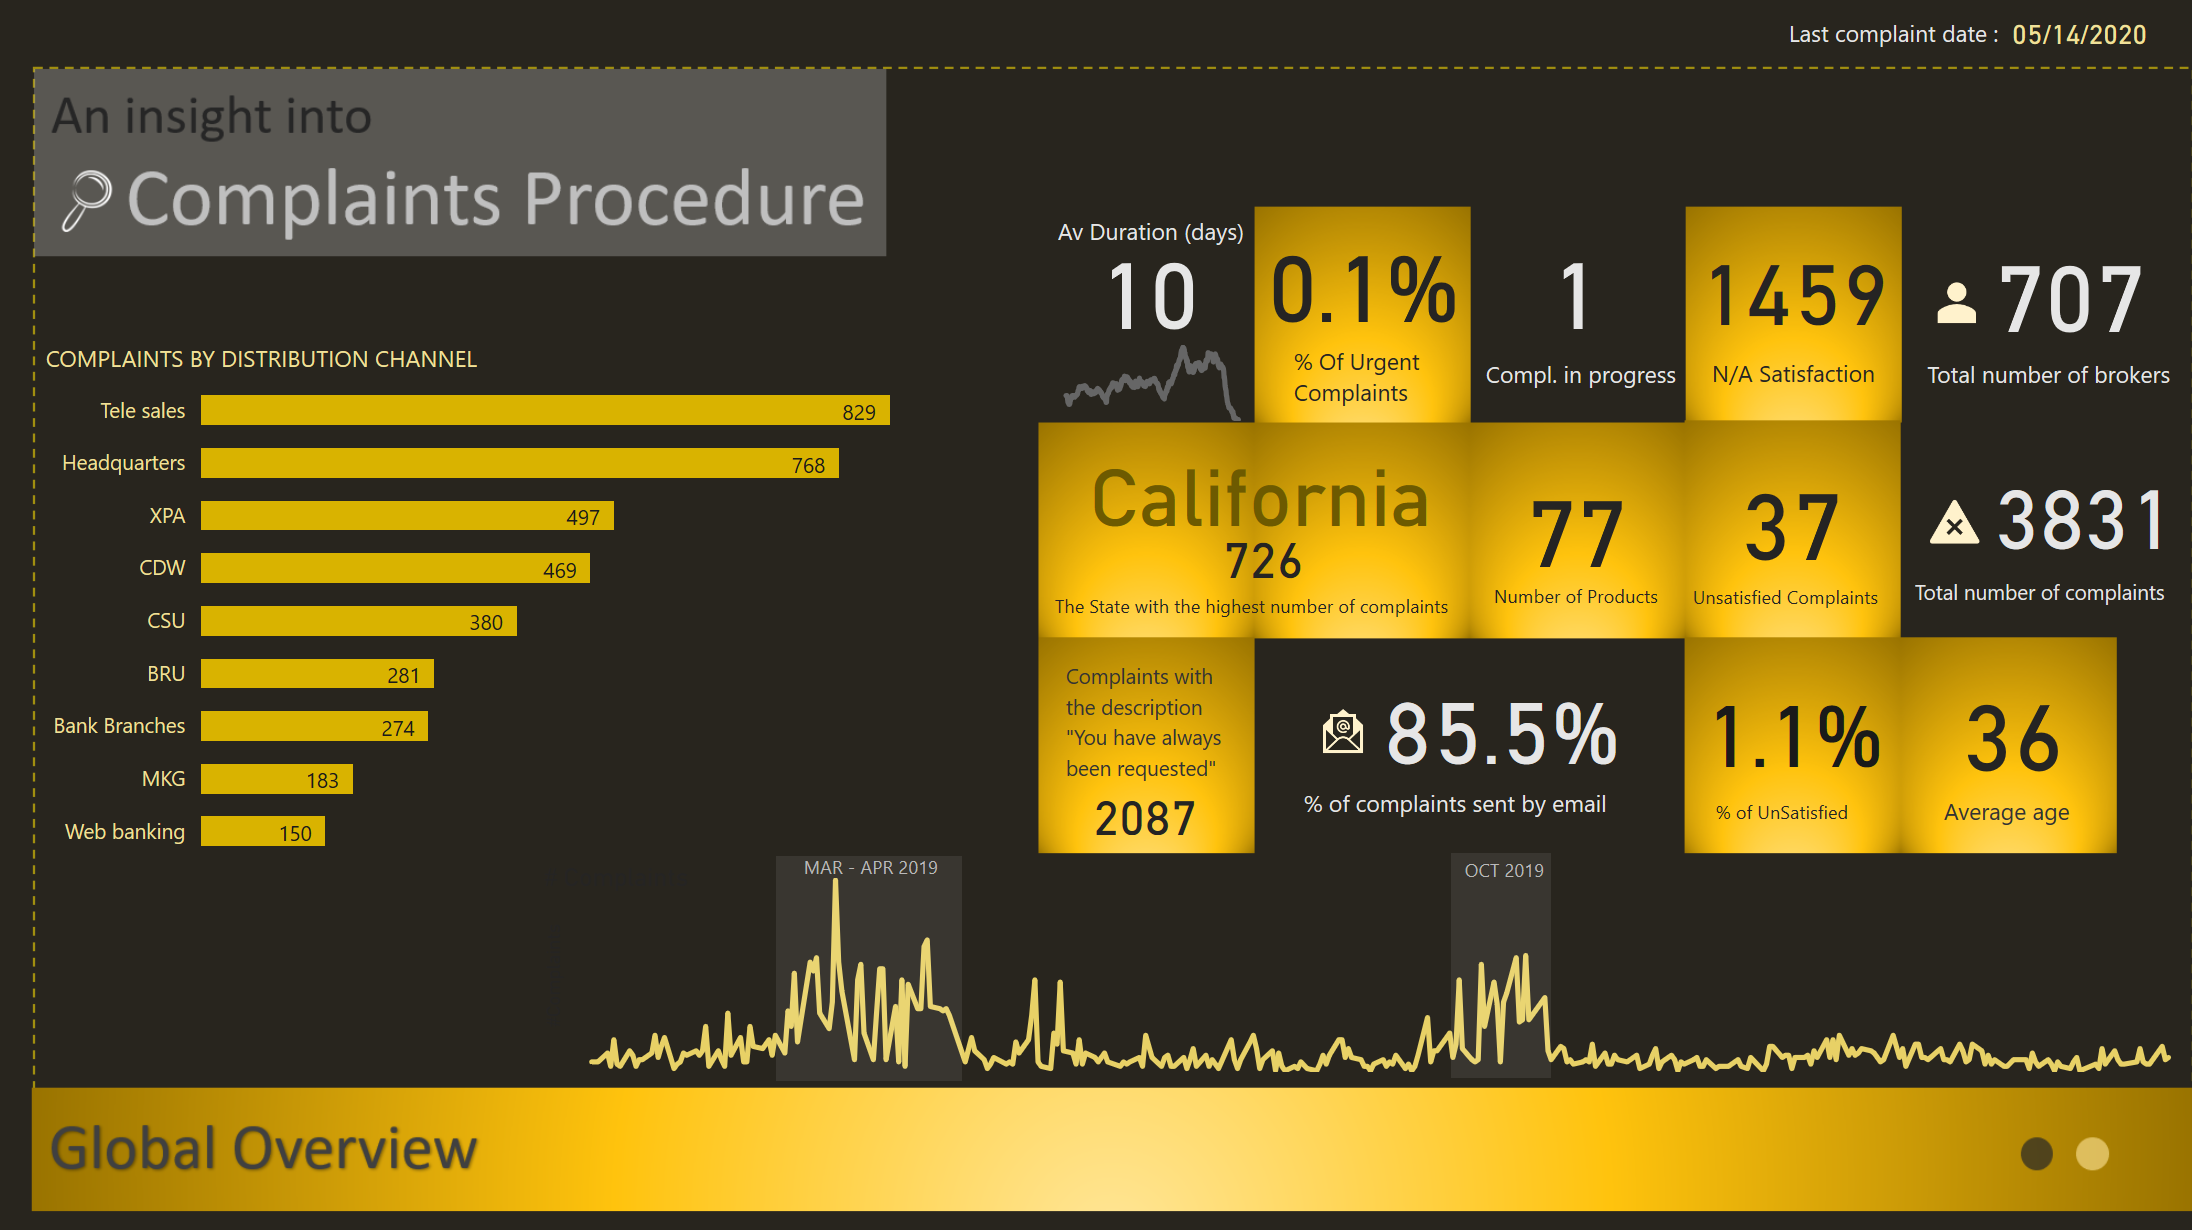
GLOBAL OVERVIEW
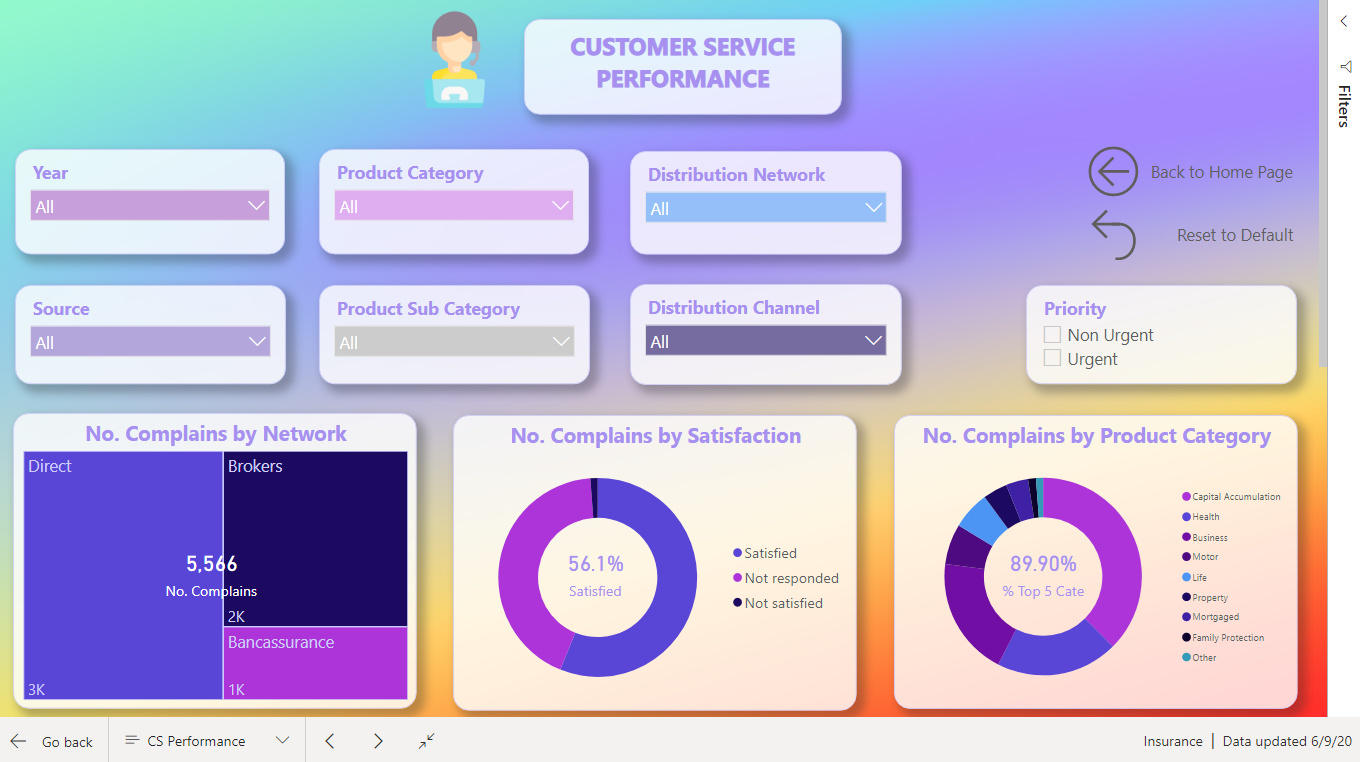
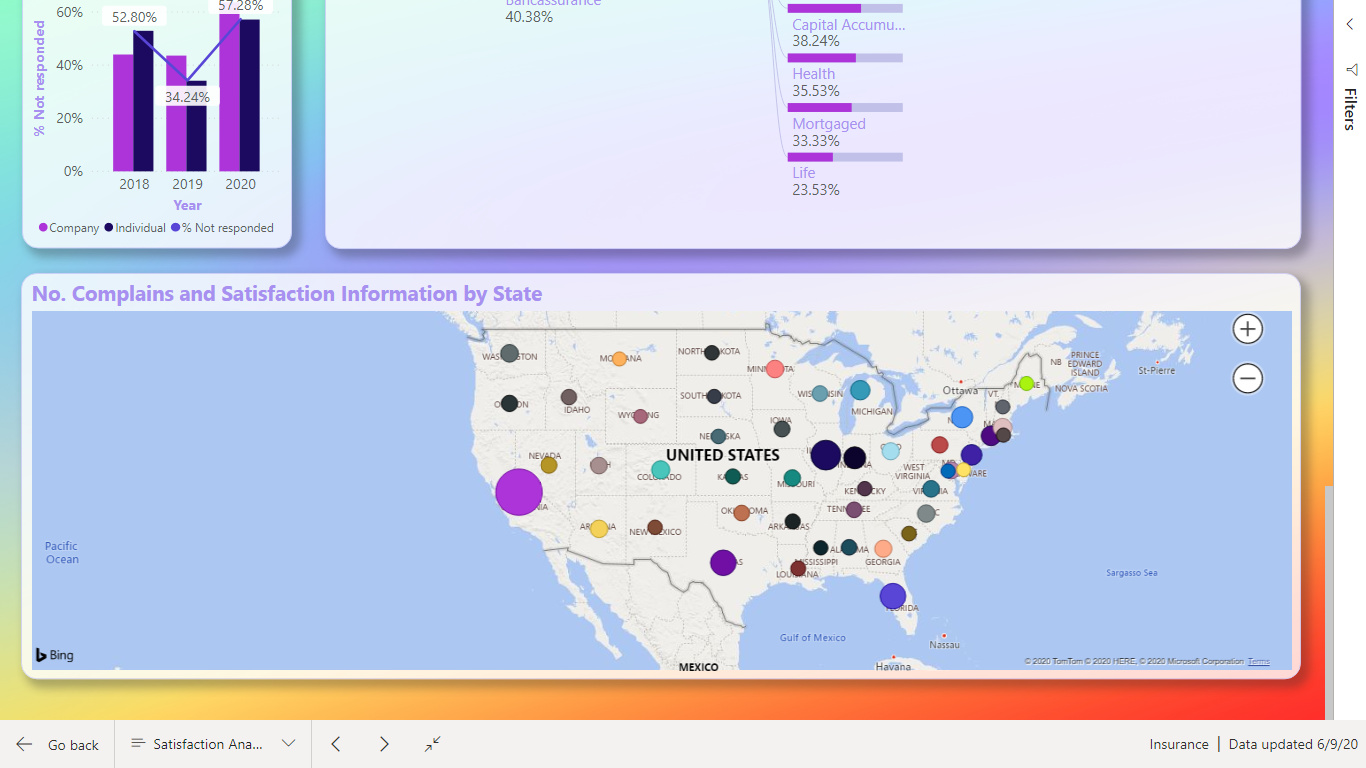
I started with a Global Overview which contains the main information I considered useful. I wanted the end users to know the main facts and numbers. Basically I wanted them to know the “WHAT and WHEN”
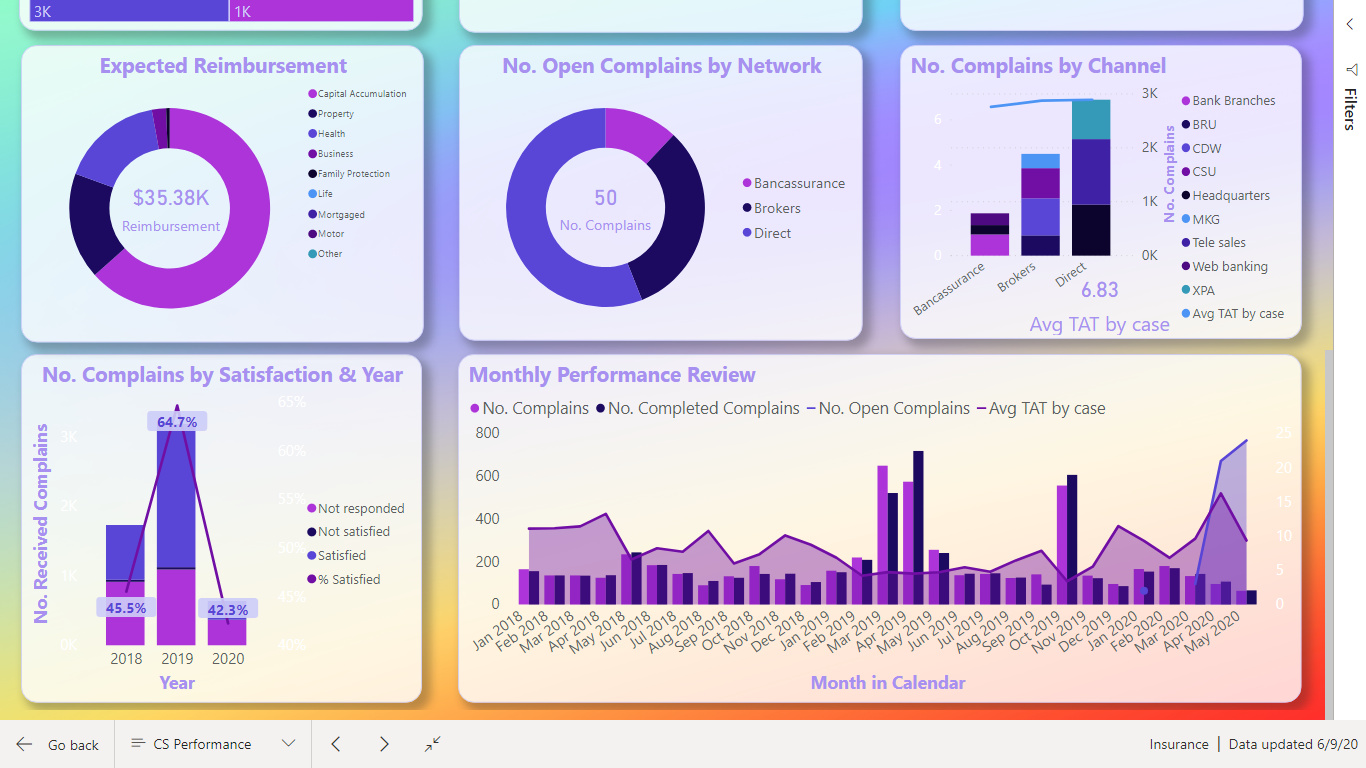
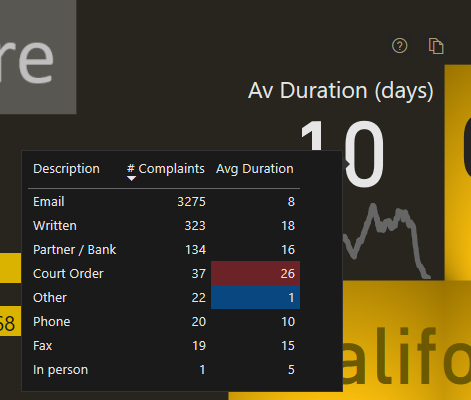
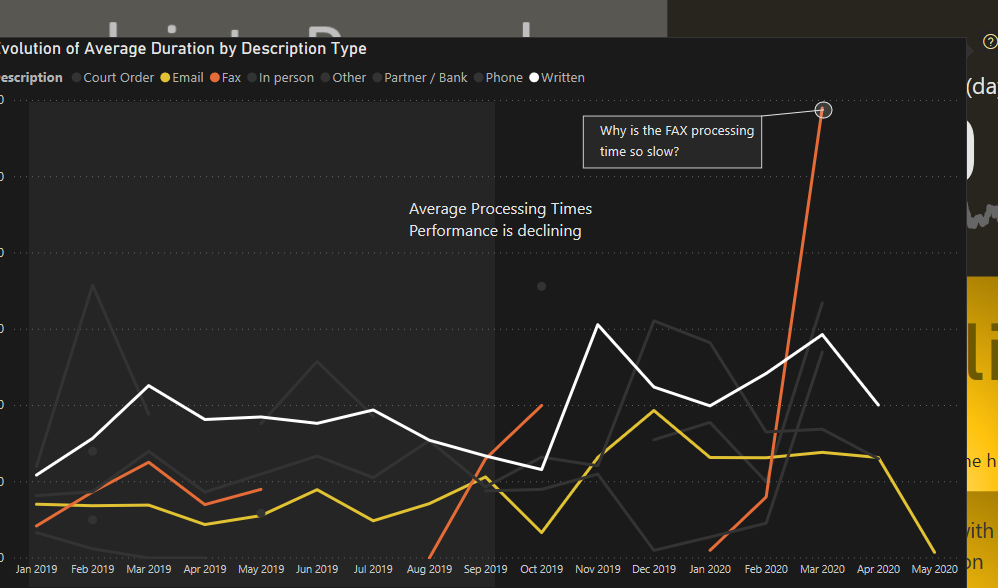
The main KPI, the one related to the Average Duration, has more information to it then we consider at first glance. We have the card that shows the average duration, the trend below, a tooltip and a Visual Header
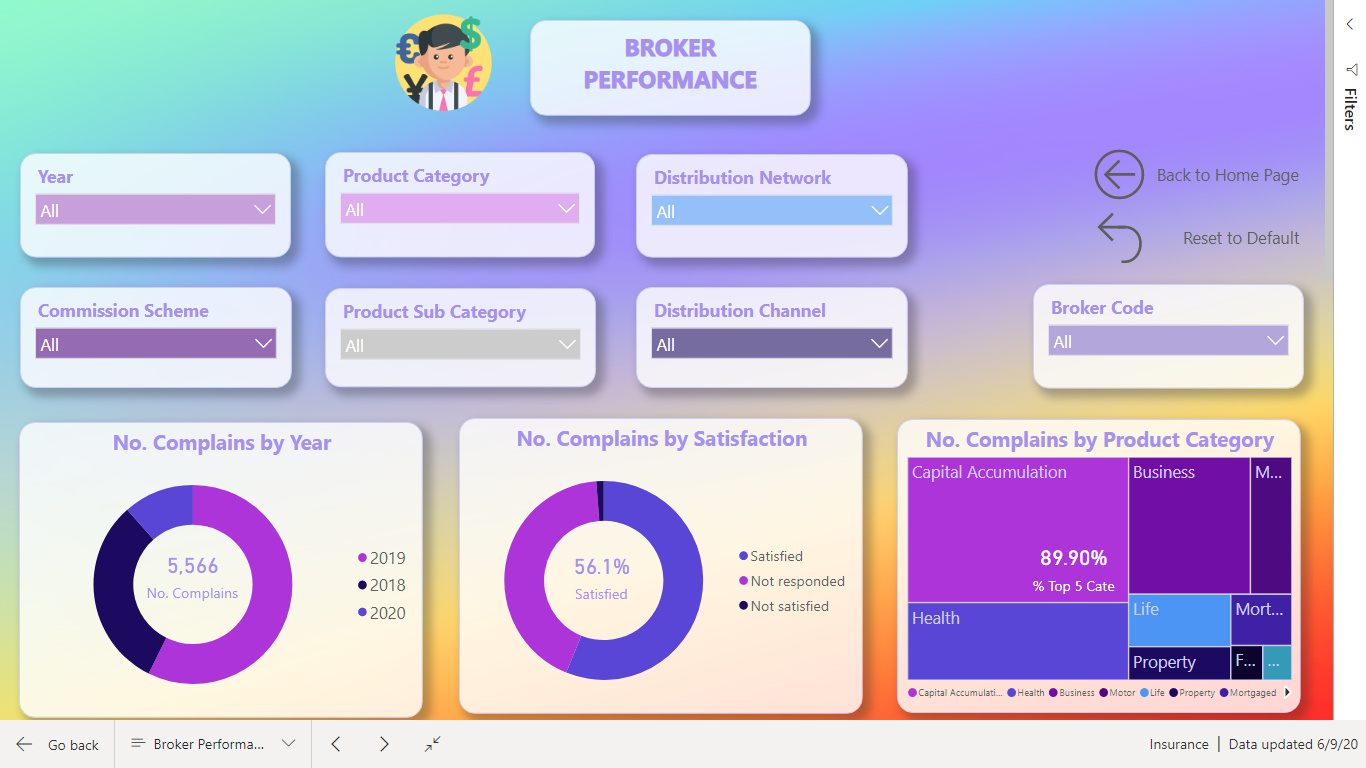
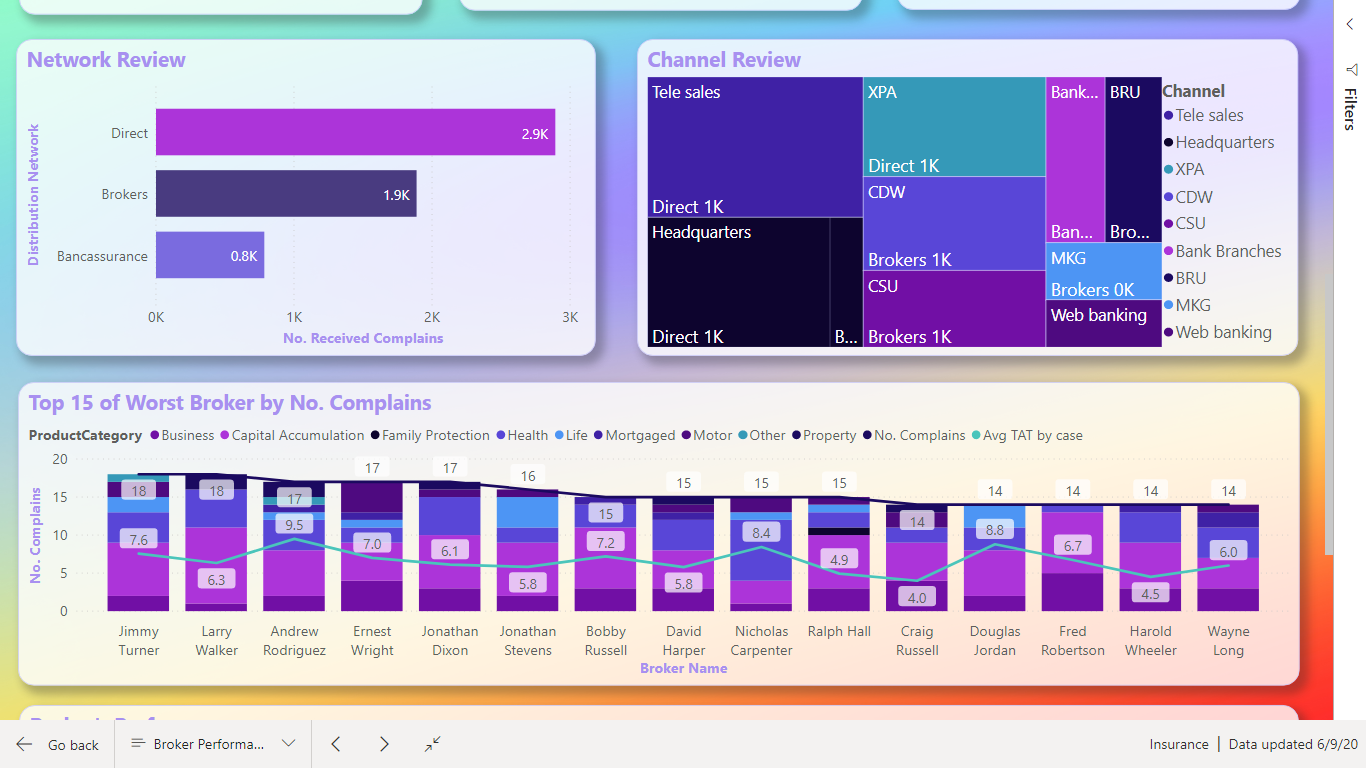
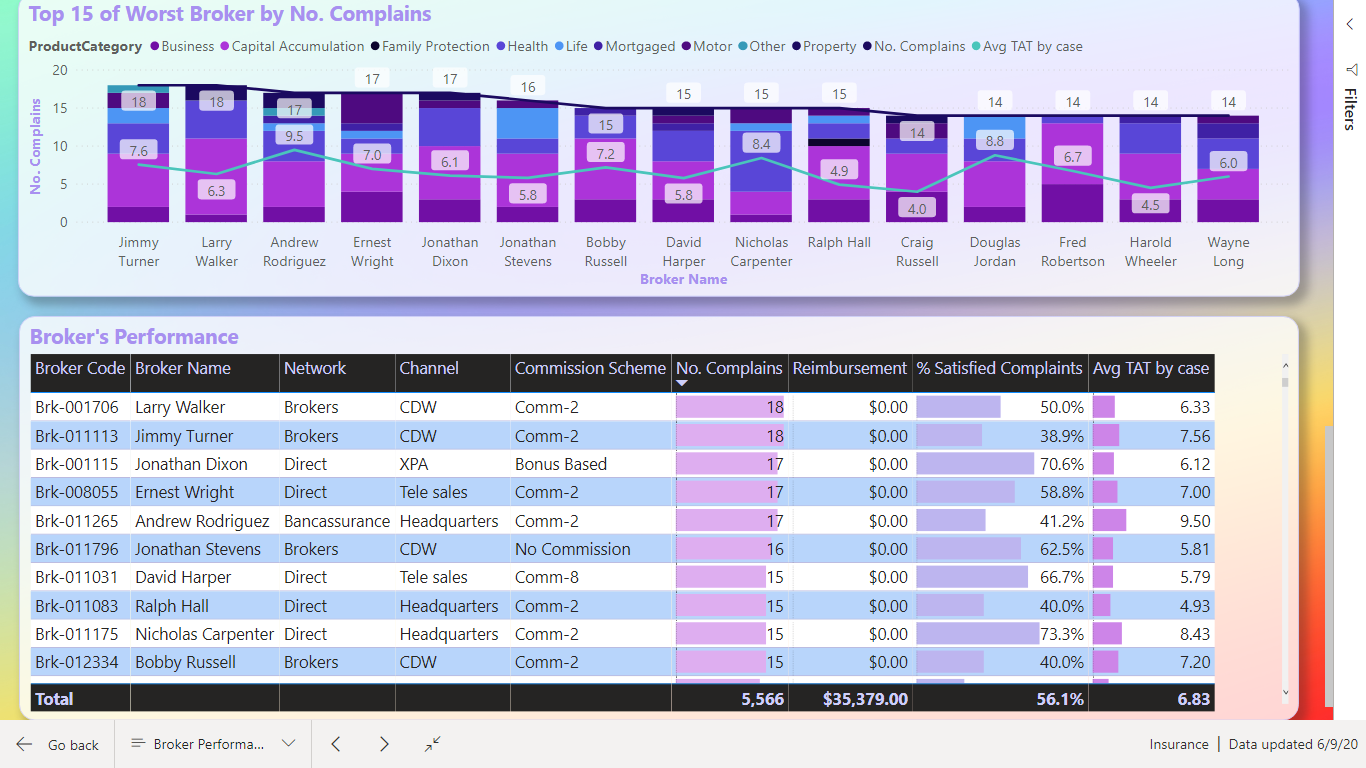
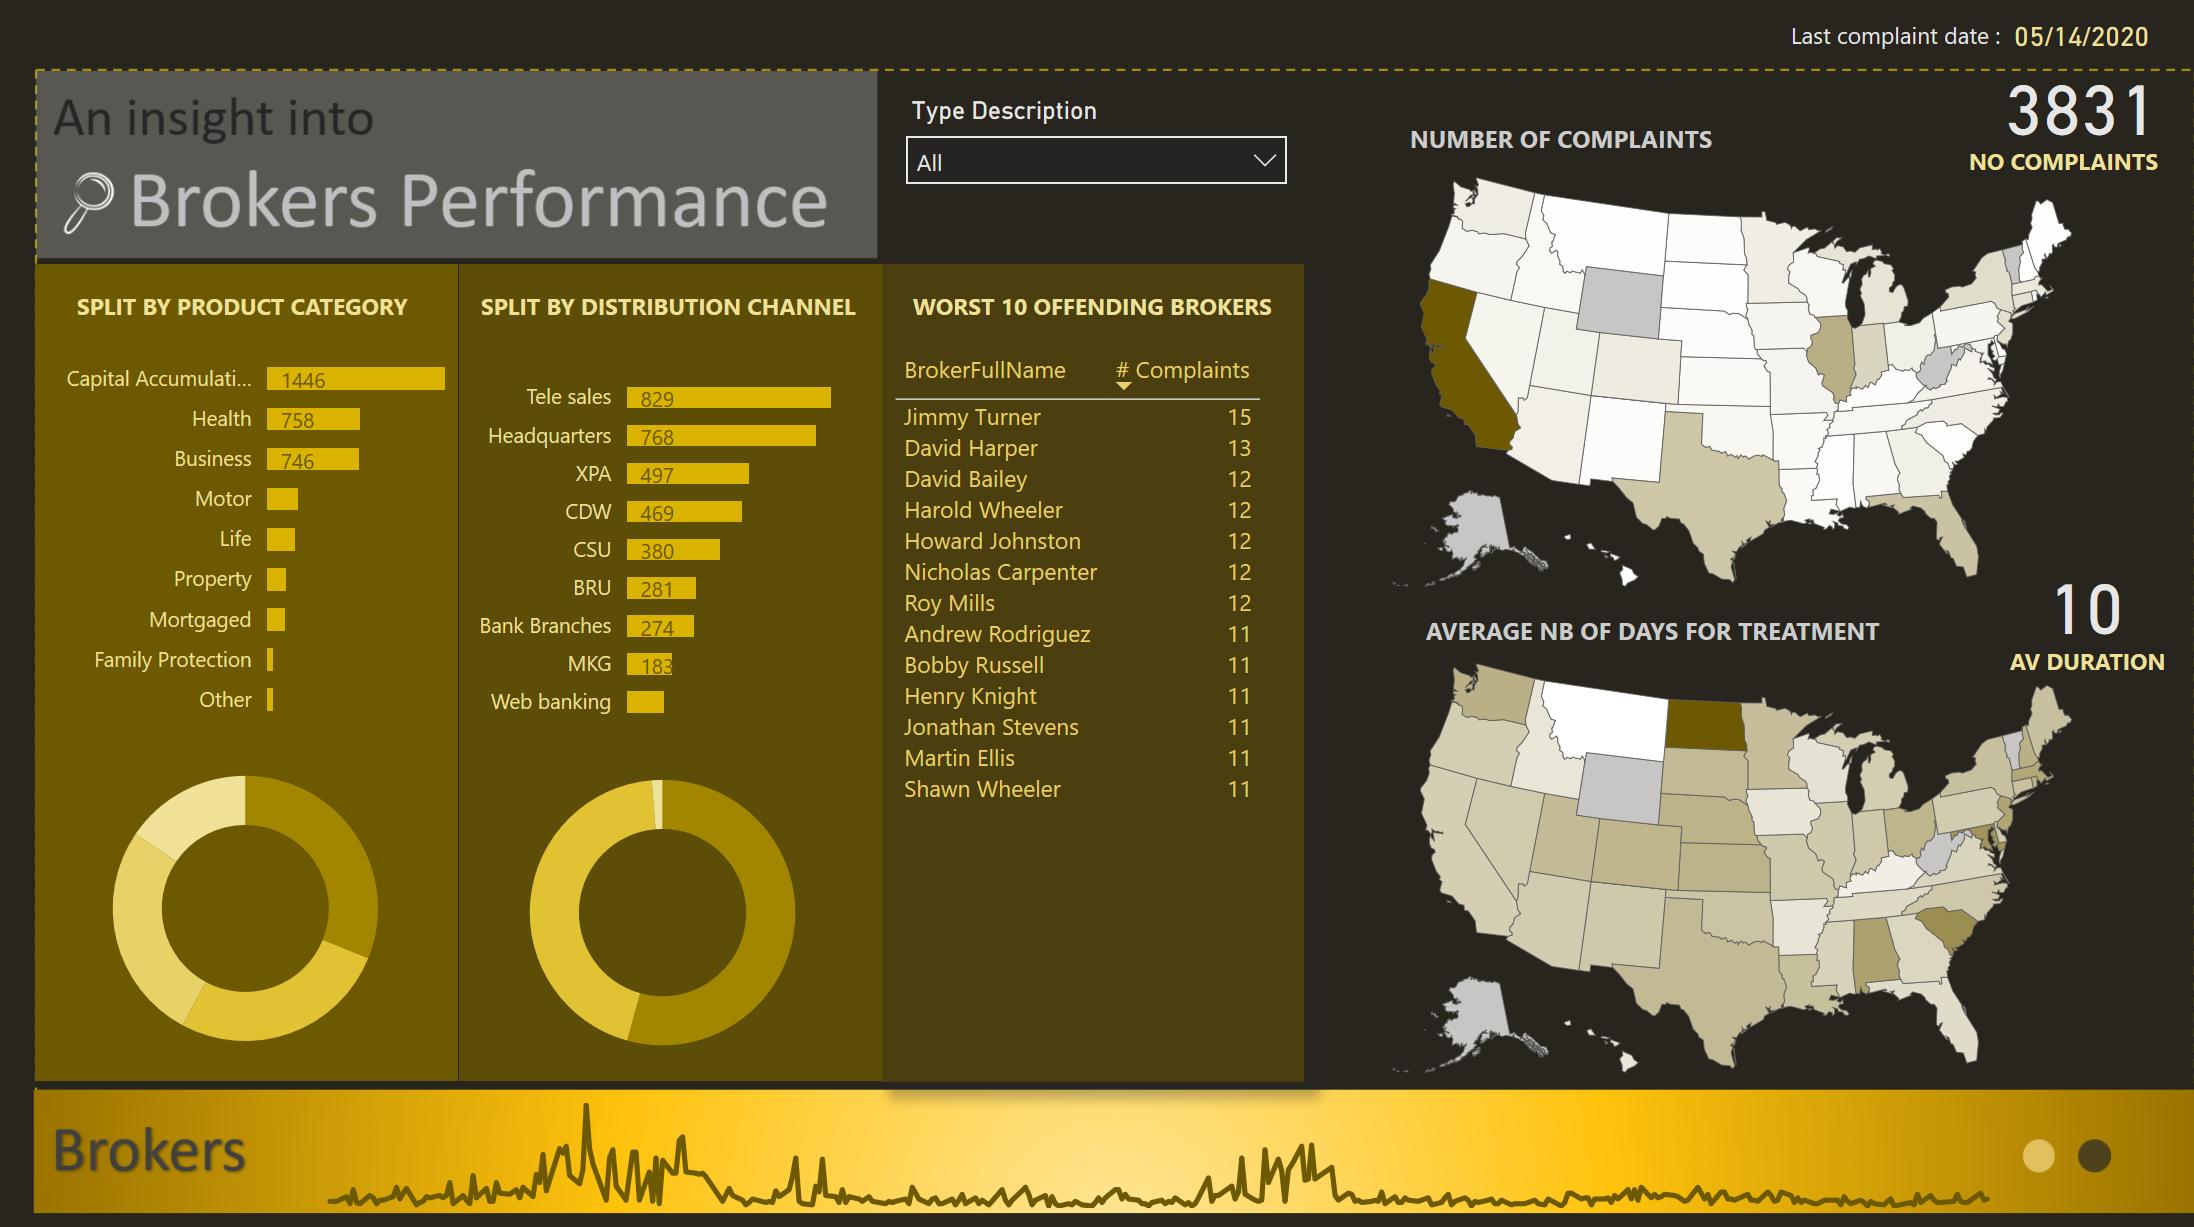
BROKERS
My second page navigation focuses on the “WHO” question.
ZOOM into MAR-APR 19/ OCT 19
By now I should have the attention of the public and the story needs to focus to smaller details.
I built the navigation so that the user could drill down into 2 periods that are the outliers of the data.
2 Periods are in this category, MAR-APR 2019 and OCT 2019
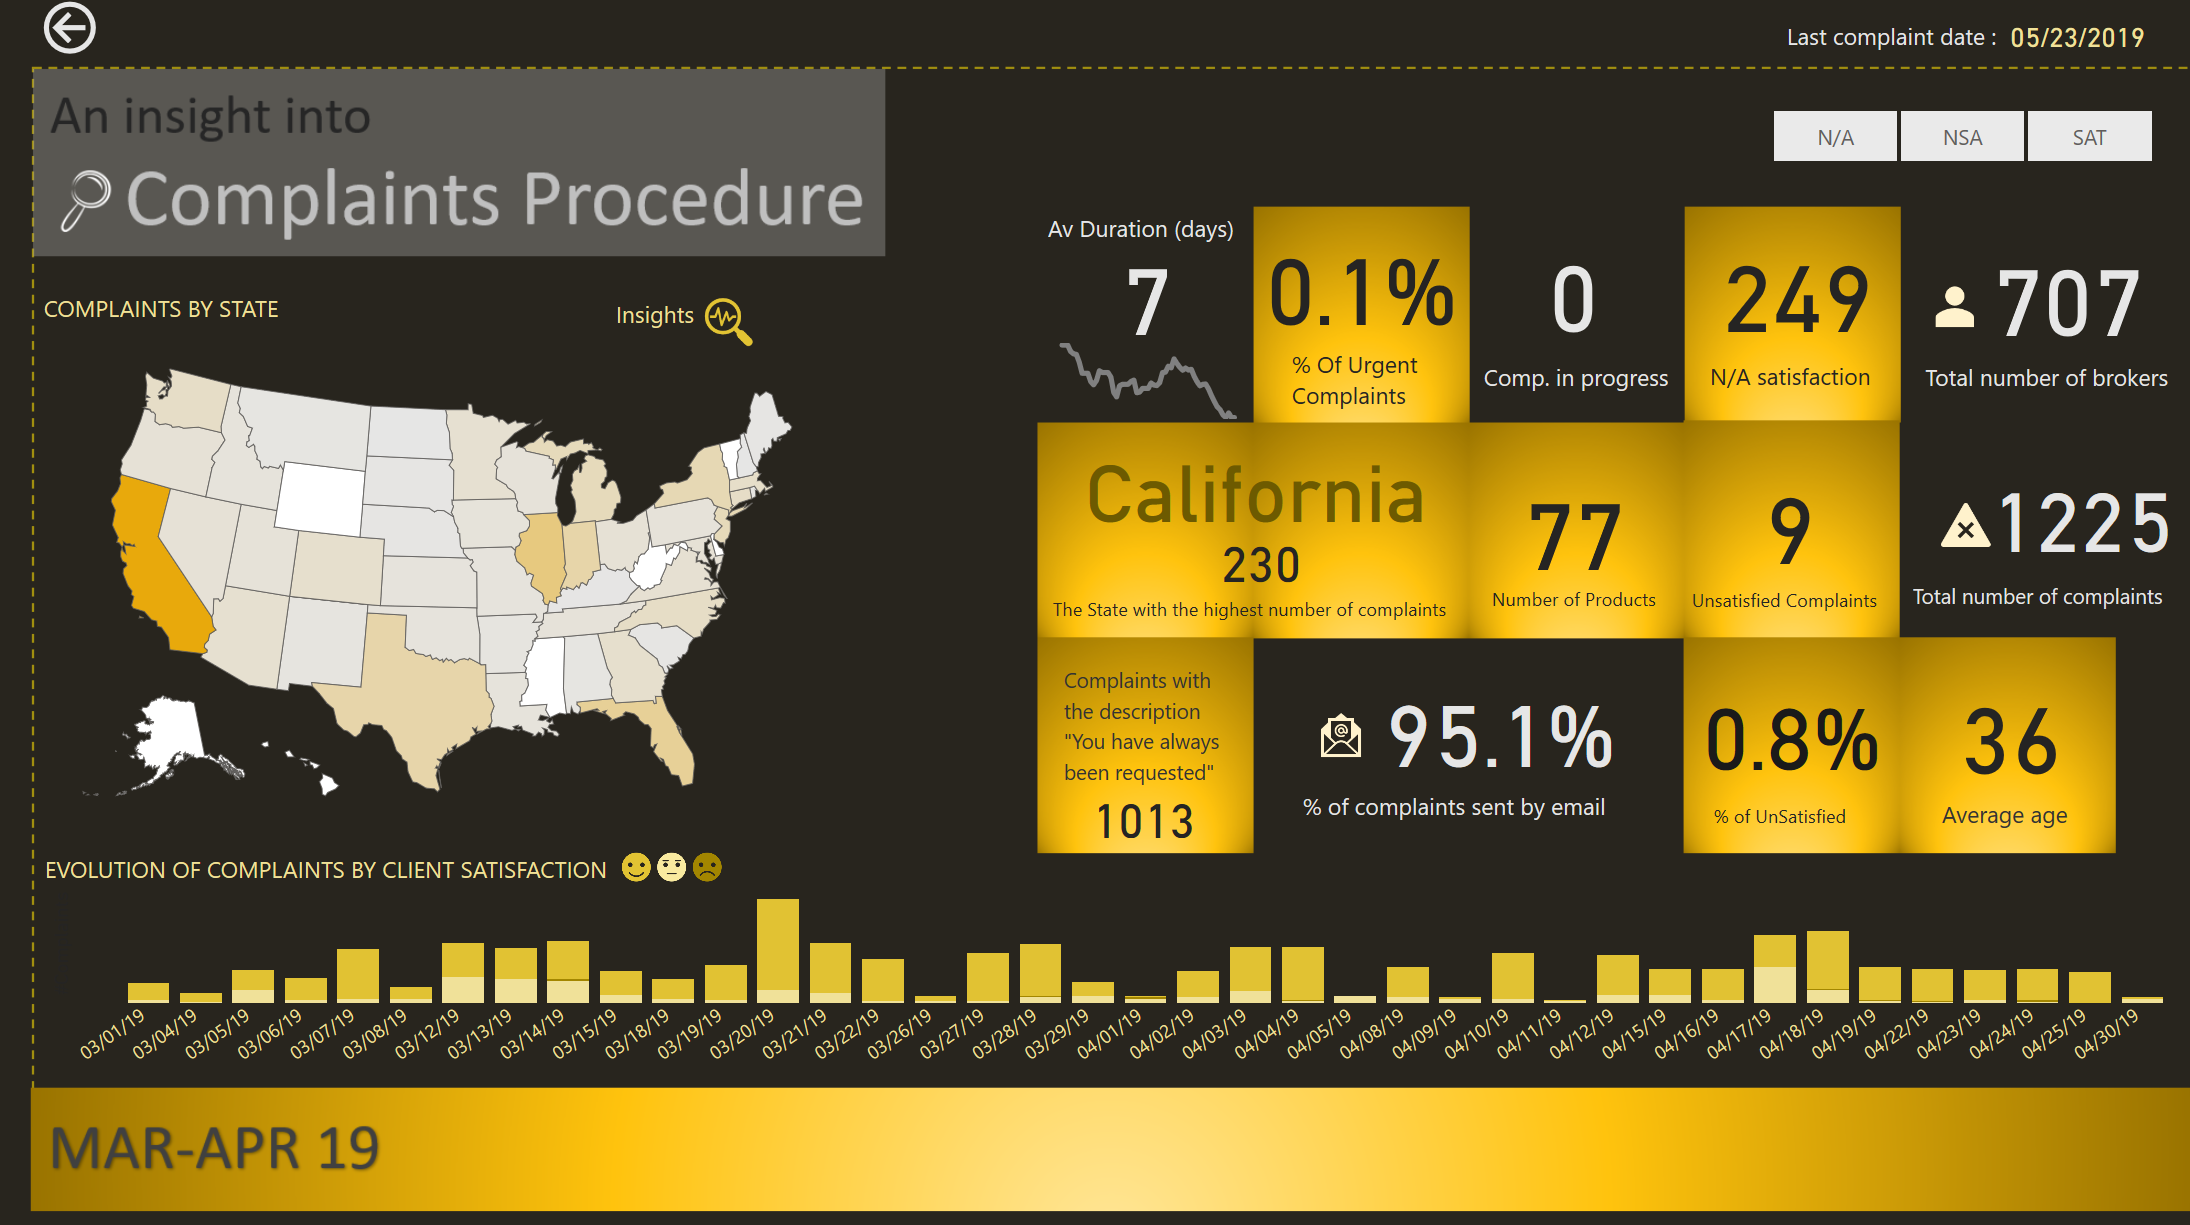
INSIGHTS AND RECOMMENDATIONS
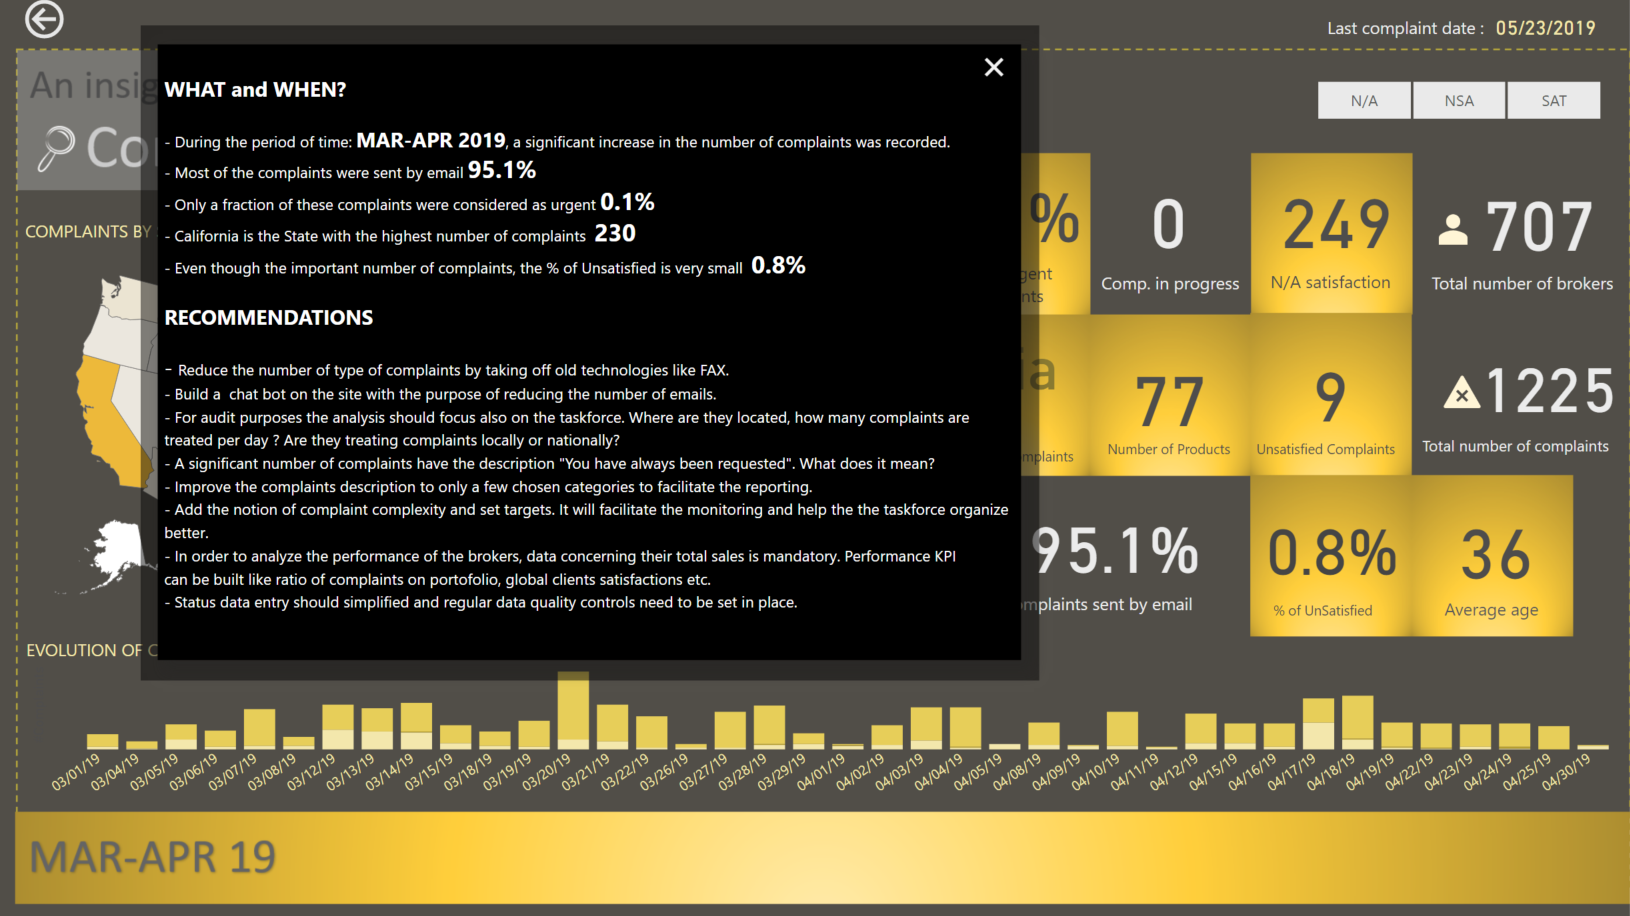
The difficulty of this challenge is that we have to provide a lot of information to the user. But to much information presented could create to much mental fatigue. In order to avoid that, I concentrated to show only informations I think are useful and added an Insight and Recommendation page.
Best regards,
Alex
GIF
Update: With the help of @BrianJ, I can now share the link for those interested to have a look.
Thank you Brian
17 Likes