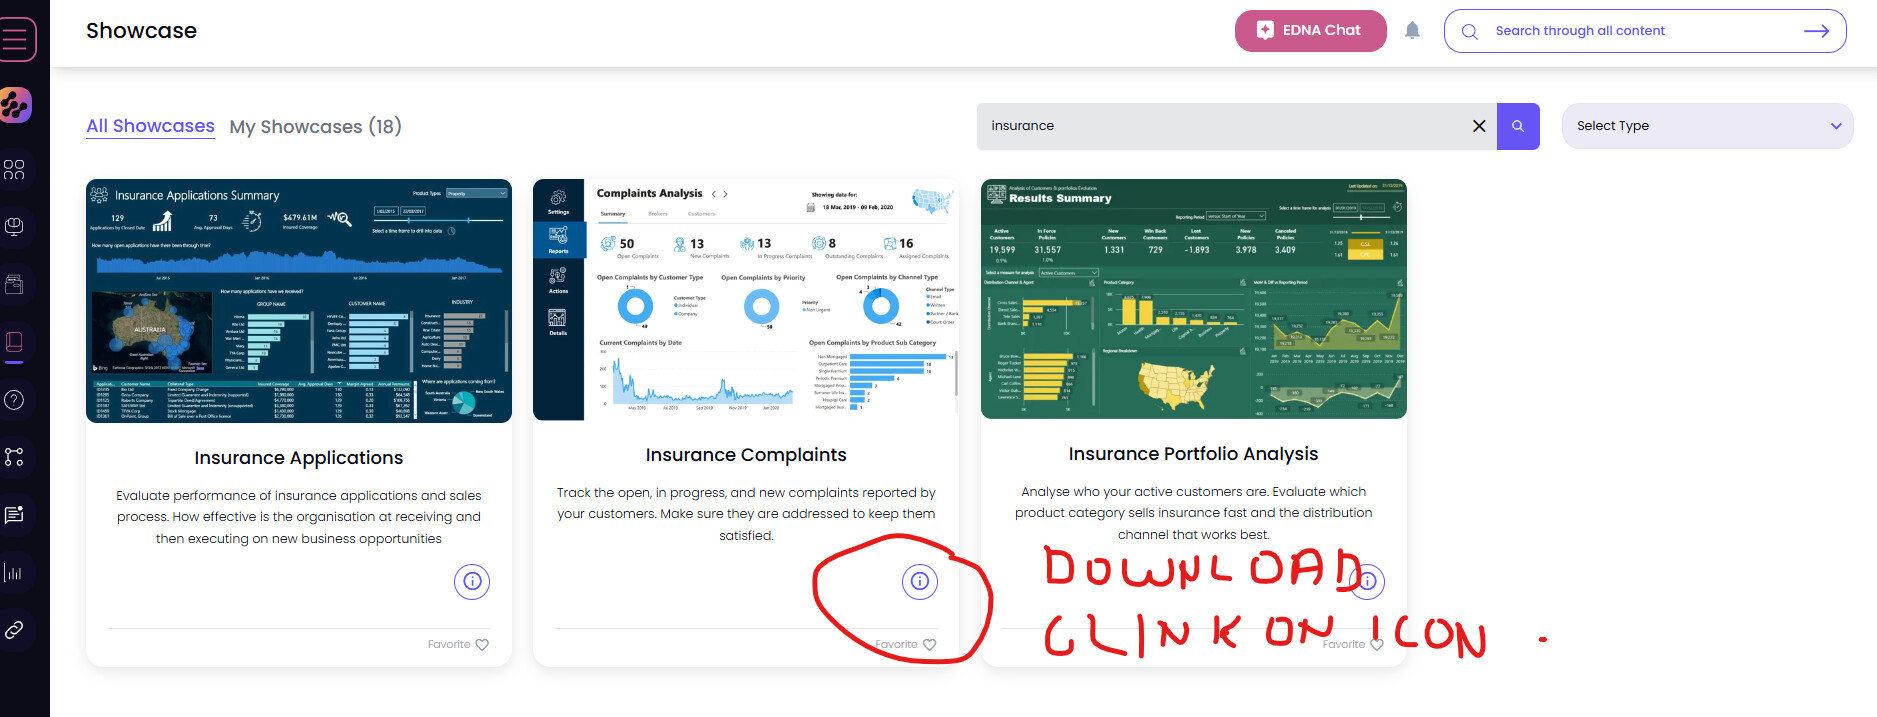
Publish to web link
So for this challenge I wanted to go all out on my UI design.
I have been totally inspired by a number of recent submissions to historic challenges, especially the one from Melissa in Power BI Challenge 5.
I really am becoming a huge fan of simple designs. They can sometimes be so compelling if they are presented in the right way.
The hardest thing about this challenge I felt was the modeling of the data. This was by far the most complex data set that we have had in any challenge thus far, but still you were able to utilize the waterfall technique and it just required a few unique relationships to some tables but nothing hugely difficult.
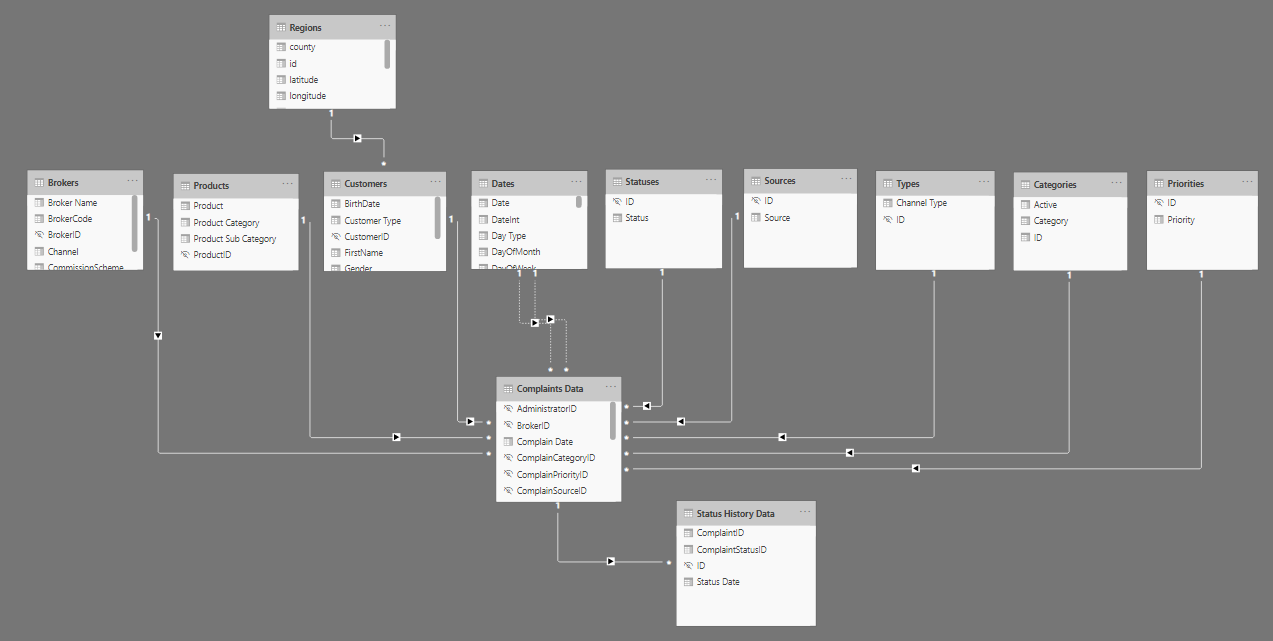
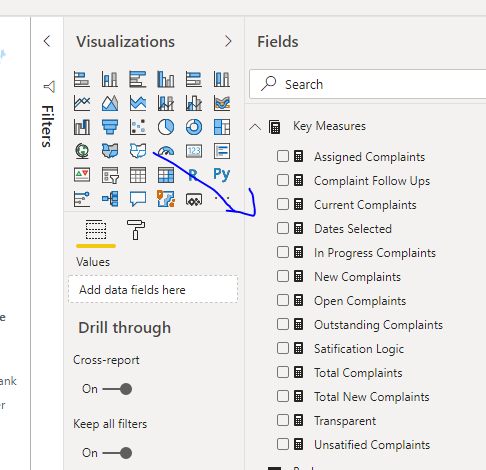
I was able to create this relatively quickly just using some of my best practices I’ve learned overtime, I then jump straight into creating a range of DAX measures which also didn’t take up too much time because I didn’t create that many overall. I did build up my measures a little bit as I started building out my report design but initially I didn’t really have that much that I felt I needed to work with.
I actually got my report design idea from the Inspiration Gallery that we have at our knowledge base. There was always this one design that I loved and I wanted to test myself and see if I could build it inside of power by because it was more like a web interface.
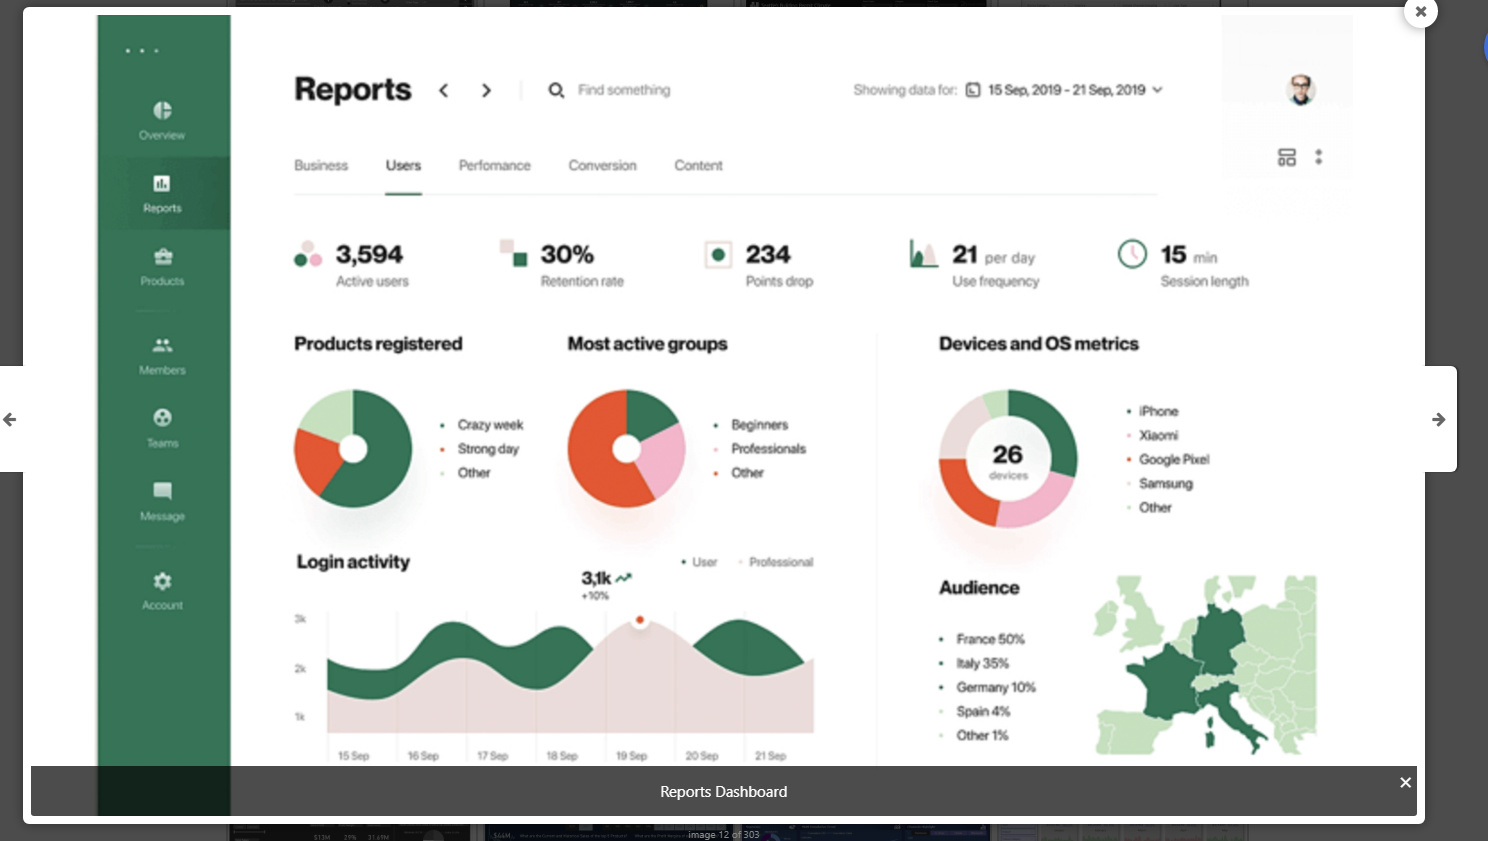
But I’d certainly seen over the past few challenges that literally anything is possible inside of Power BI now with the report navigation and tooltips in bookmarks that you can all combine in together.
So I decided to leverage this idea and embed the same look and feel into my report. And I think it worked pretty well. And really is actually a design that could be easily converted to another report and just with a few minor adjustments to colors and icons etc could be repurposed really easily which I might actually do in the future.
Due to the way I wanted to showcase the design I had to break out a few things across different pages. What I did though and this is a huge tip is I’ve completed one full page first and made sure everything was set up exactly how I wanted it in other pages. Then all I had to do was duplicate the page and do a few simple rearrangements and that set up how I developed this by a number of hours easily.

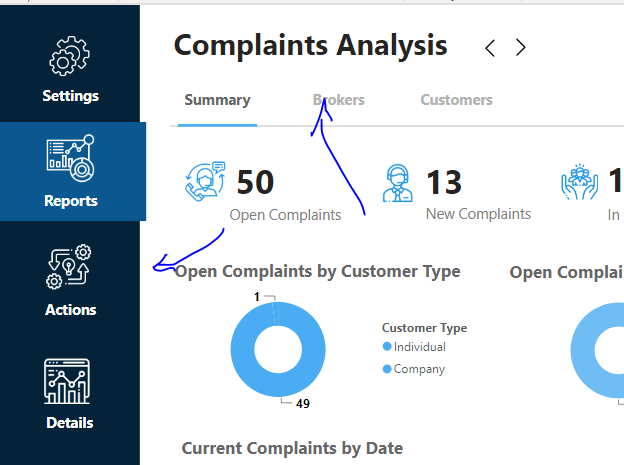
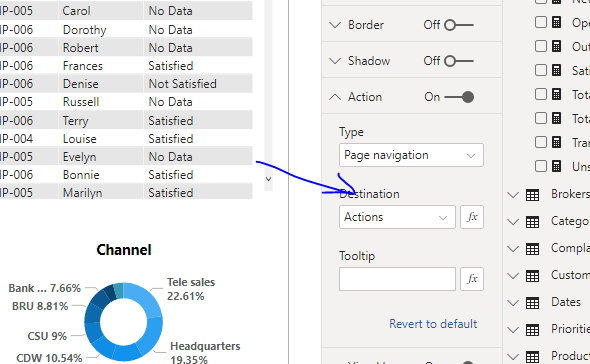
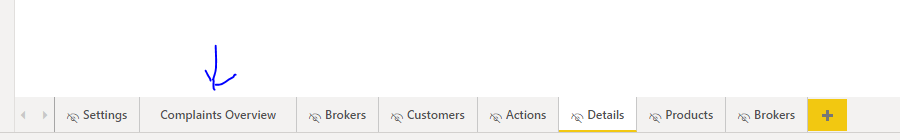
The report navigation aspects of it is really not that difficult anymore it was just finding icons that I had in my files and placing some page navigation actions into the icons, I did the same for the different pages in the reports section as well.
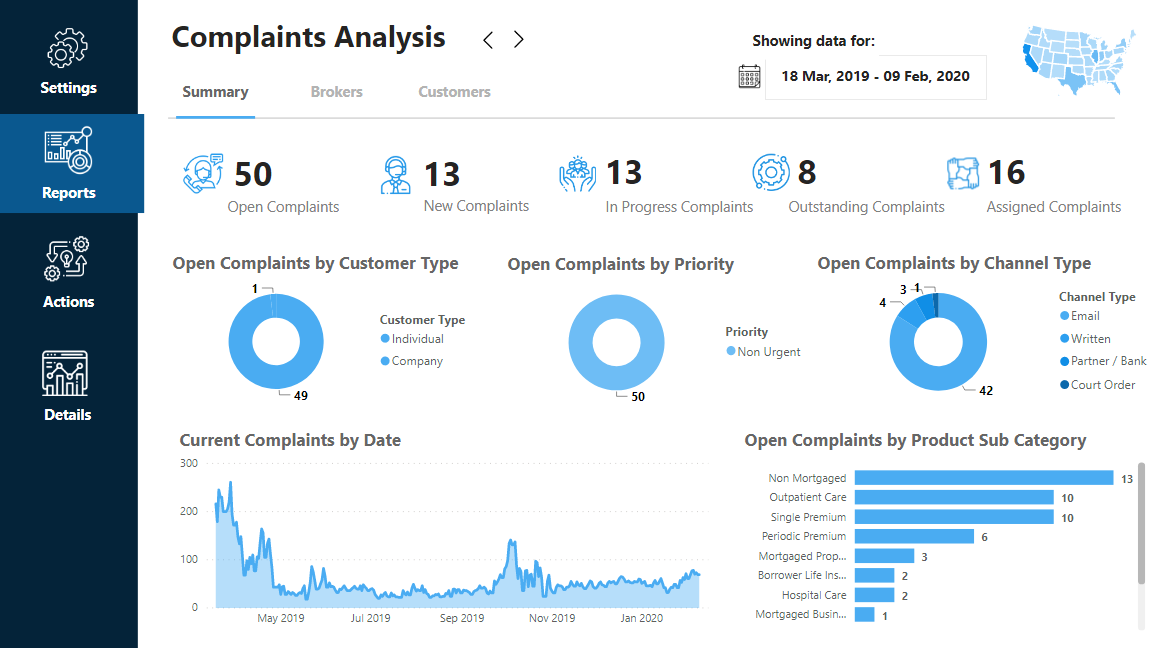
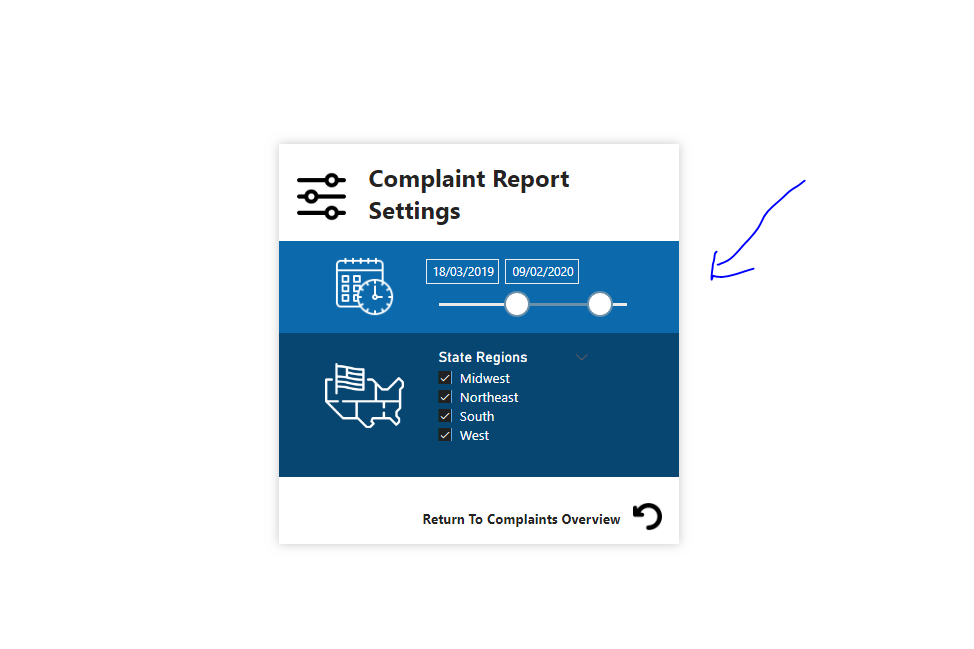
And then also I created a settings page where you could set the time frame and regions once and it would sync across all the different report pages. So I liked doing this because it meant that the user didn’t have to set things up at every page they could just do it once and everything would be highlighted for that particular selection.
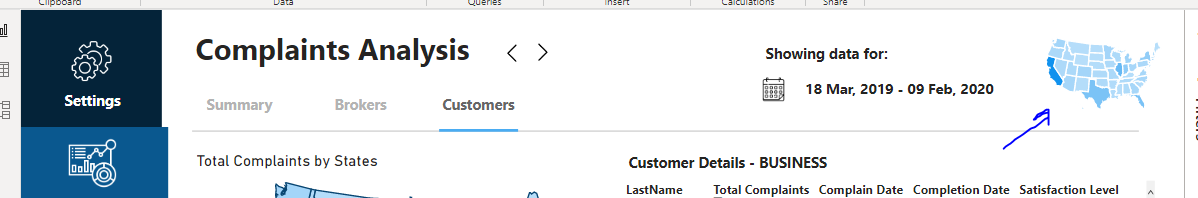
I also like how I eventually used the shape map visualization as a unique filtering mechanism on each different page. I had this set up in the top right hand corner and it made it super easy to see some insights but then also navigate to individual regions as well.
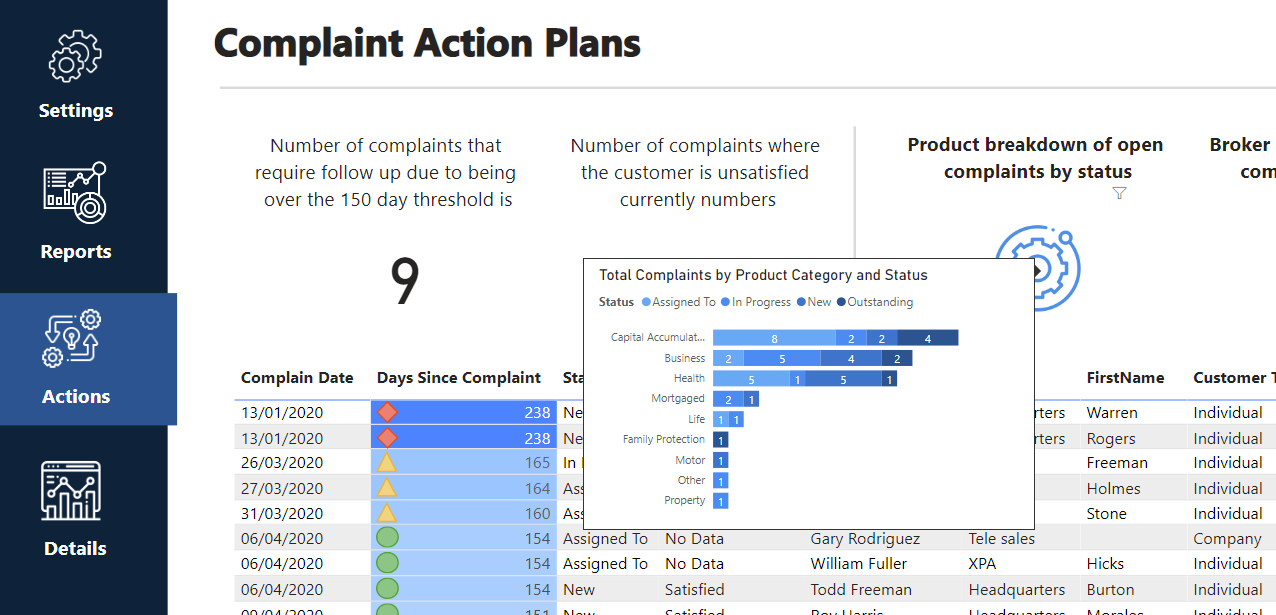
I also really wanted to showcase some tooltips in this particular challenge. This is something I’ve really started to love and have been inspired to learn more about after seeing these in other submissions. I kept it pretty simple but I think it does add so much value to your insights. I also used a really unique technique to embed a tooltip into an image which I’ll definitely share in a future video how I did this.
Overall I really went for it this time round. I wanted to make sure that I showcased a whole range of insights in a compelling way and then I wanted to build this really unique navigation experience across the report to almost make it like a high quality web based application.
When you actually use this online with the published web link you’ll see that you don’t actually have any pages to select all of the navigation gets done within the actual report itself. And I think this is actually how things should be and I’m seeing a range of innovative ways that you can set this up within your reports. So I recommend everyone having a really good thing about navigation and how innovative and creative you can be with it and how much it can affect the impact and value of your reporting applications that you’re building.
Thanks everyone for an amazing challenge once again. The level of submissions is off the charts and I’m just so inspired by everything that’s being showcased.
Thanks
Sam