Hello everyone,
This was one of the best Data sets from @haroonali1000 and I really enjoyed working on it and learned tremendously.
There is a vast amount of analysis that can be extracted from this Data set and as usual, the amount of talent from other participants was astounding.
Query Editor:-
-
As per the requirement, at first, I decided to filter the data in the Query Editor for two years but, after some consideration, I thought loading the whole Data and applying filters on all pages instead would make the Report flexible to view in different time frames if there is a need. So, that’s what I did.
-
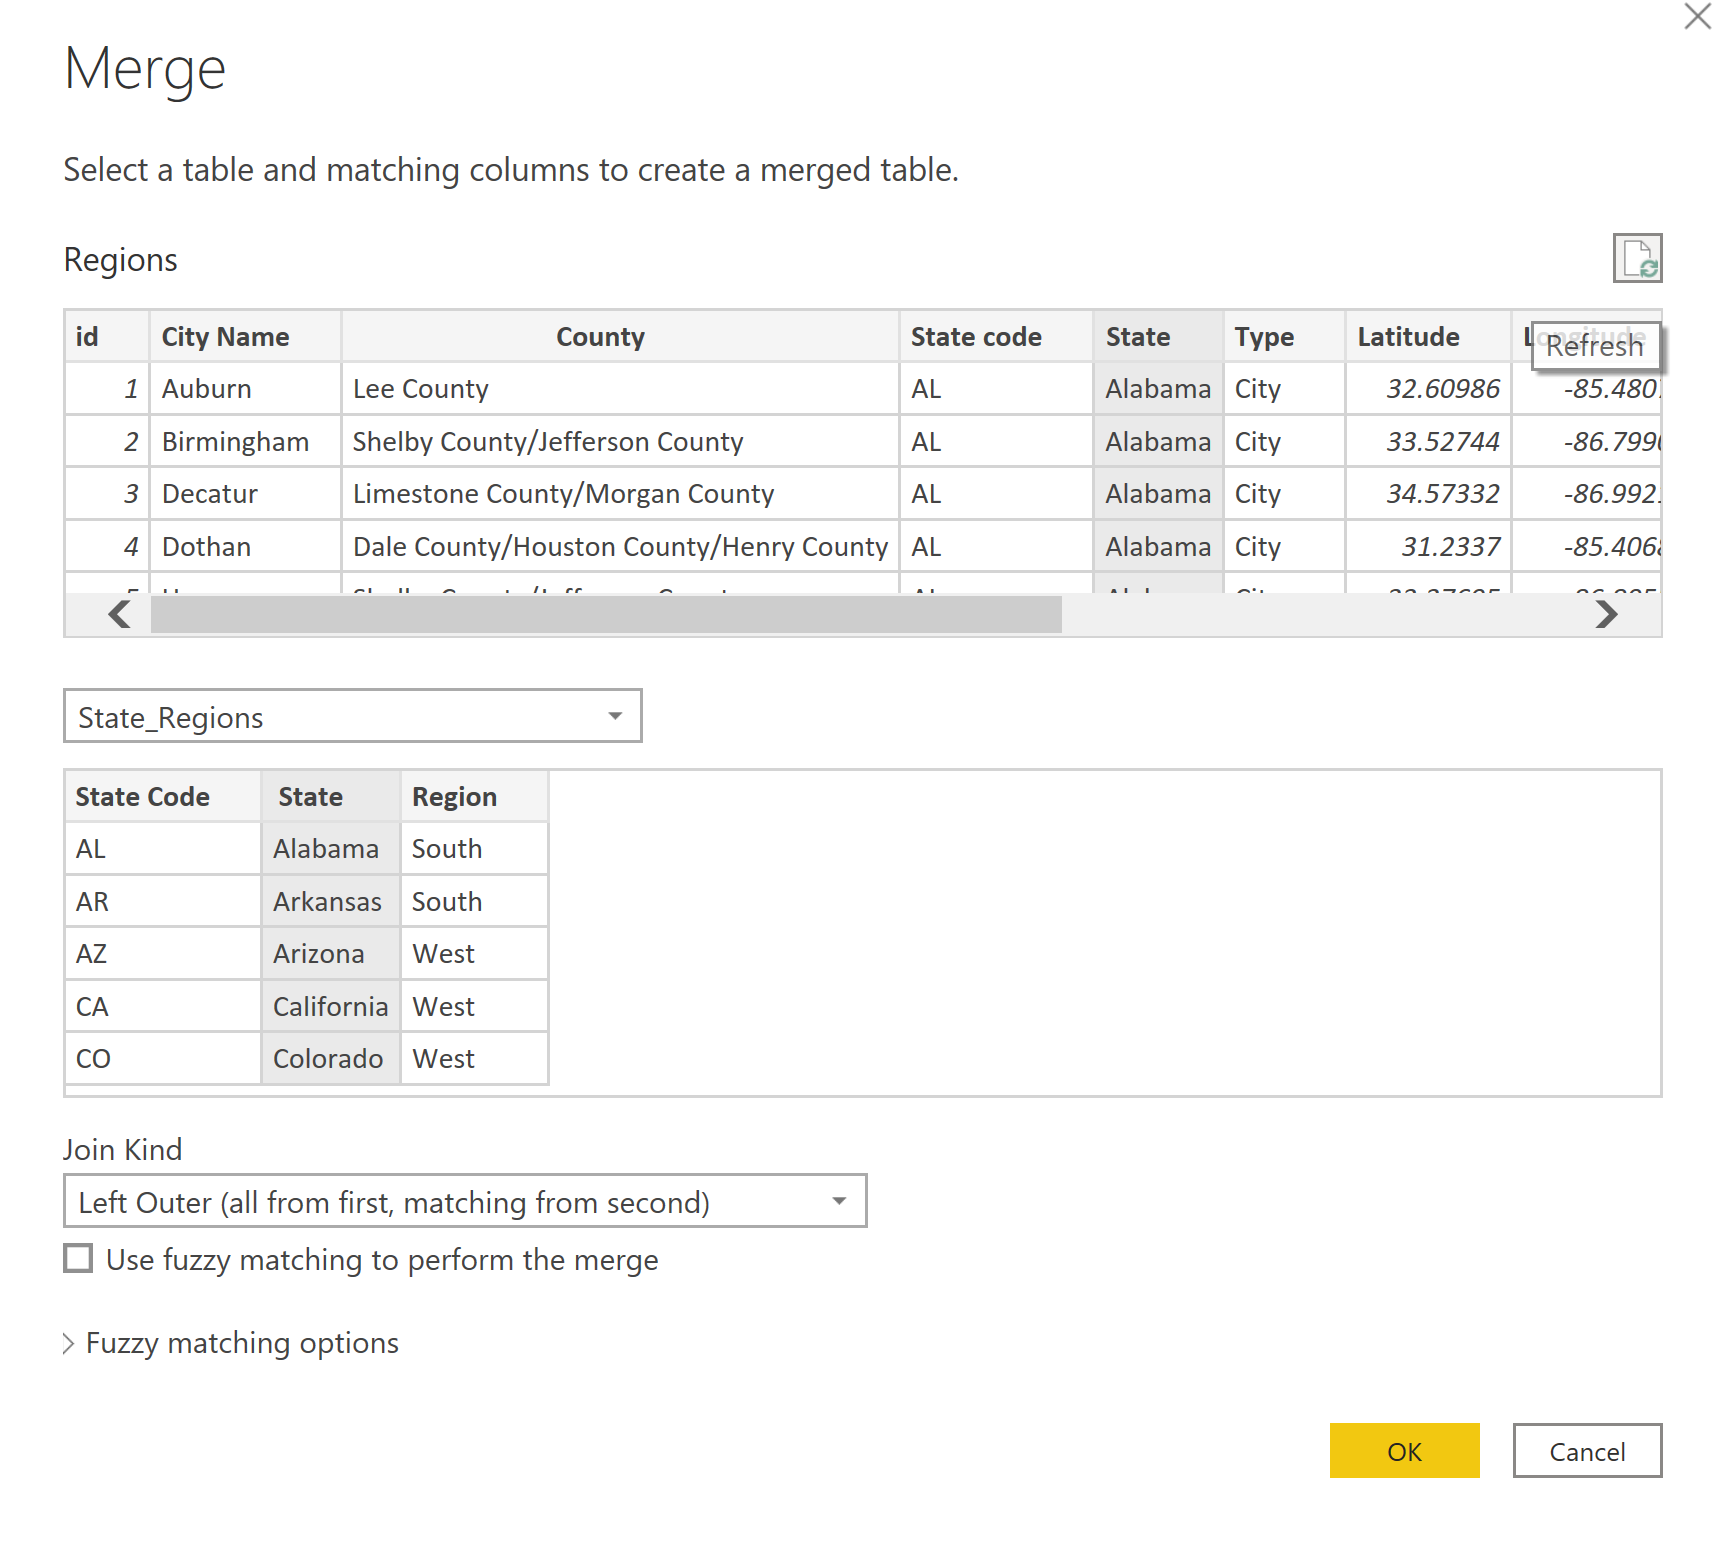
I Left joined the State_Regions table on state column and Merge it with Regions table and created a Regions column.
- I used @Melissa 's date M code to create a Date table.
Data Model:-
DAX and Visualizations :-
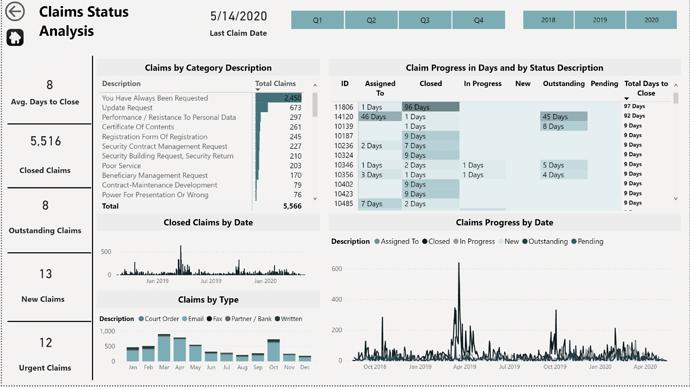
On most of the visuals the DAX calculation used were not too complicated.
except the Claim status.
It took me awhile to figure out how to calculate the difference between the status dates in days between statuses.
After doing some research online, First , I used the following formula to create a column with day difference between statuses on the Status_History table :-
Diff. Current v Prev. Dates =
VAR Mindate = CALCULATE( MIN( Complains[Complain Date] ) ,
ALLEXCEPT( Complains , Complains[ID] ) )
VAR Demoteddate =
CALCULATE(
MAX( ‘Status History’[Status Date] ) ,
FILTER(
ALLEXCEPT( ‘Status History’ , ‘Status History’[Complaint ID] ) ,
‘Status History’[Status Date] < EARLIER( ‘Status History’[Status Date] ) ) )
RETURN
IF( ‘Status History’[Status Date] = Mindate ,
DATEDIFF( ‘Status History’[Status Date] , ‘Status History’[Status Date] , DAY ) ,
DATEDIFF( Demoteddate , ‘Status History’[Status Date] , DAY ) )
Then I created a measure to Concatenate the day numbers & " days" . :-
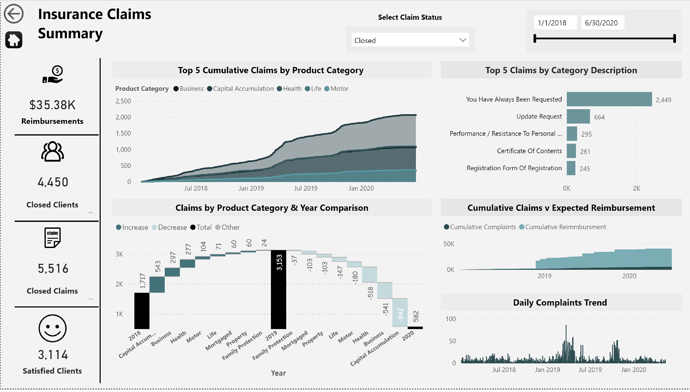
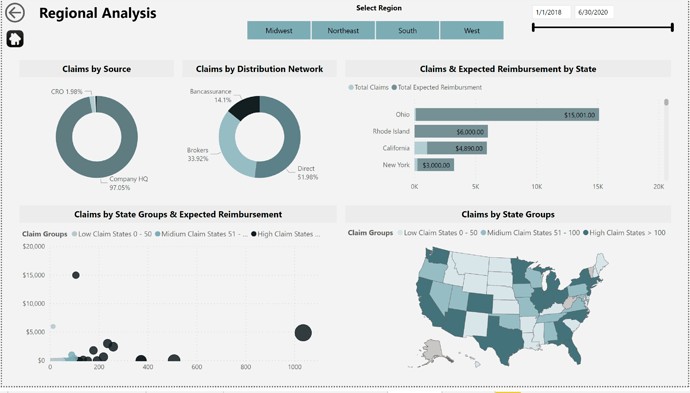
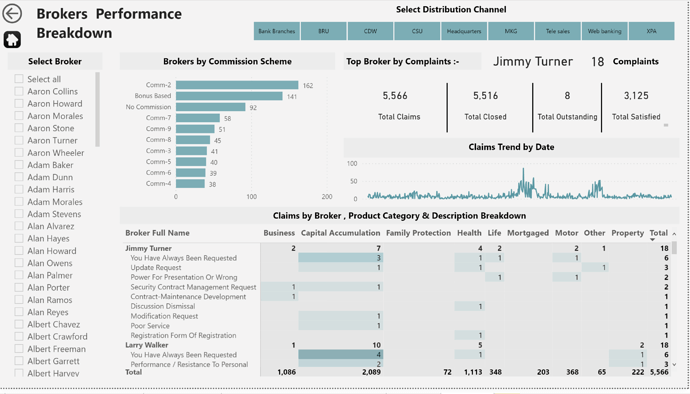
Some of the Titles of the visuals are dynamic and change based on the selection made on
the slicers and some visuals.
I used measures on the Text boxes for the titles on the Fx to make them dynamic based on a selection.
As an example,
Selected Broker Claims =
SELECTEDVALUE( Brokers[Broker Full Name] , “Total” ) & " Claims"
is used to change the title when a broker is selected.
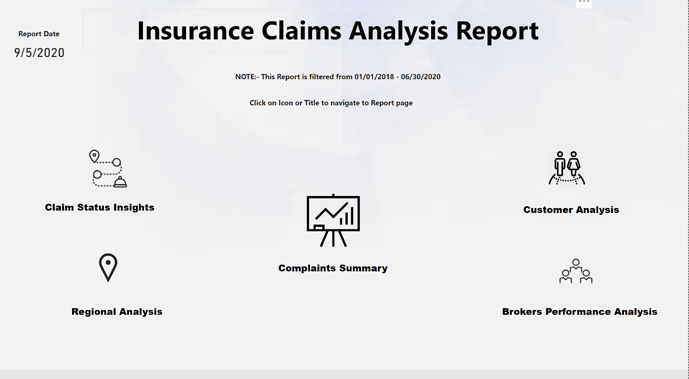
For the visual inspiration, I read online that darker backgrounds are not printer friendly in case some one
wants to print the report and if there are a lot of pages to look at, it is better if the colors used are lighter to make it easy on the eyes. Therefore, I went with a lighter background and used very few light colors.
Thank and regards,
Nebiyu.
P.S. I improved the Home page after some feedback from @BrianJ.