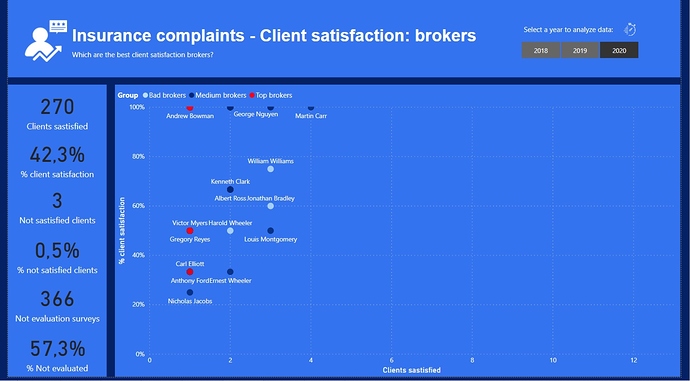
Here’s the entry from one of our non-member participants, Matteo.
Here’s how Matteo described it:
I read the brief and watched the work of Marieke on Enterprise DNA Forum, which inspired me much. I wanted to create a report fully dynamic and interactive with all informations needed.
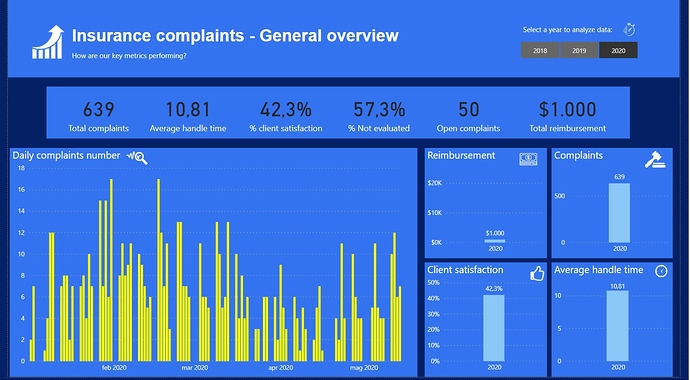
So at first there is a summary slide where you can view all essential informations such as the number of complaints, % of client satisfaction and of surveys with no answer or the trend of daily complaints.
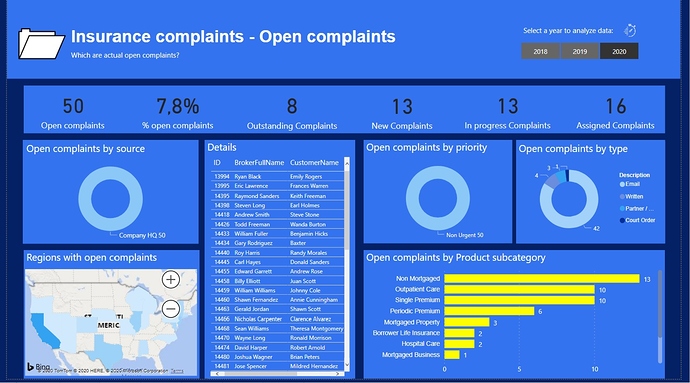
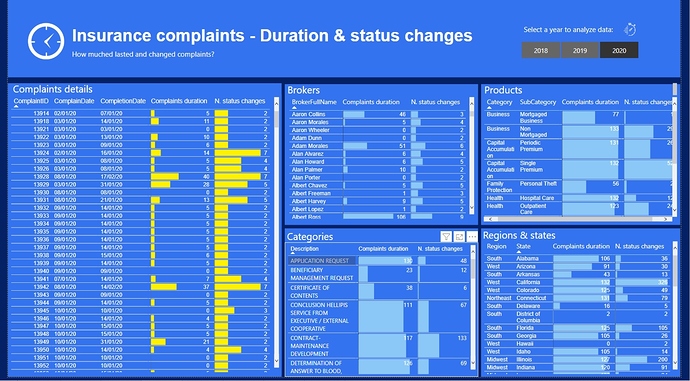
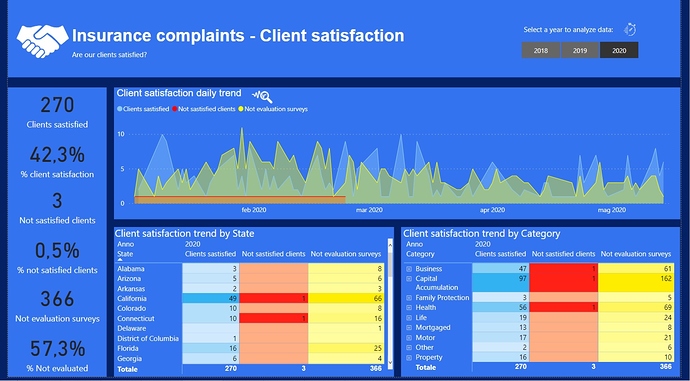
After this, there are insights on specific and important issues, that are open complaints, duration and number of status changes, client satisfaction and at the end a focus on brokers and customers.
A little of time I want to spend on the slide called “Client satisfaction: brokers”, because it is the main thing of parting with the works I saw before concluding mine. Here I wanted to know and see who are the best brokers in terms of number of clients satisfied and % of client satisfaction. In this way, I created a column in order to classify brokers according to results of precedent year. I attach the image with the code used to classify brokers.
To learn about the real-life scenario presented for the challenge, be sure to click on the image below.
