Hello Fellow Enterprise DNA Rock Stars,
I really enjoyed this challenge from start to finish. This one took a little more time than I usually spend, due to the complexity of the model. Spent most of the time getting the data model structured. I did not create a bunch of measures for this one, tried to keep things simple and easy to understand. One of the first things I did was remove the customer type of “company”, and only kept “individual”. That is the main reason my numbers are a bit off from everyone else’s entry. I did not think comparing individual to company made much sense, and a majority of the data set revolved around the individual.
Company Logo & Colors
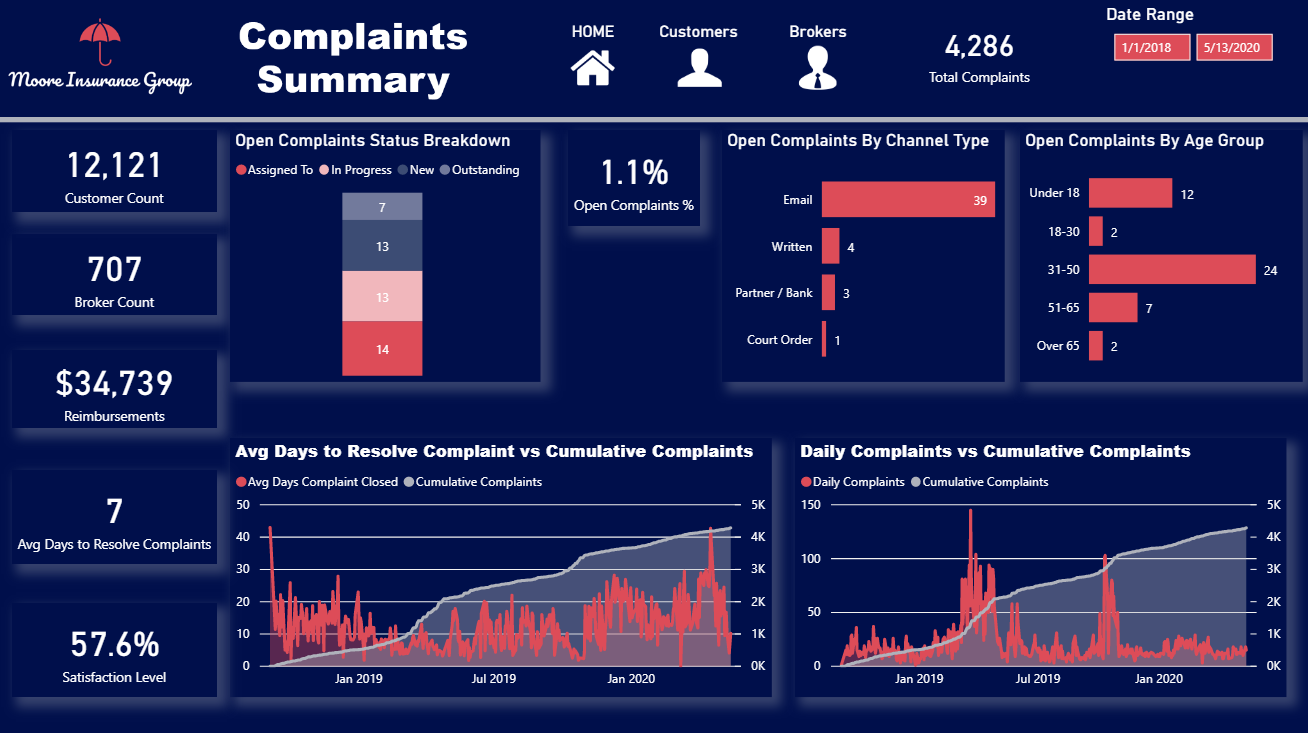
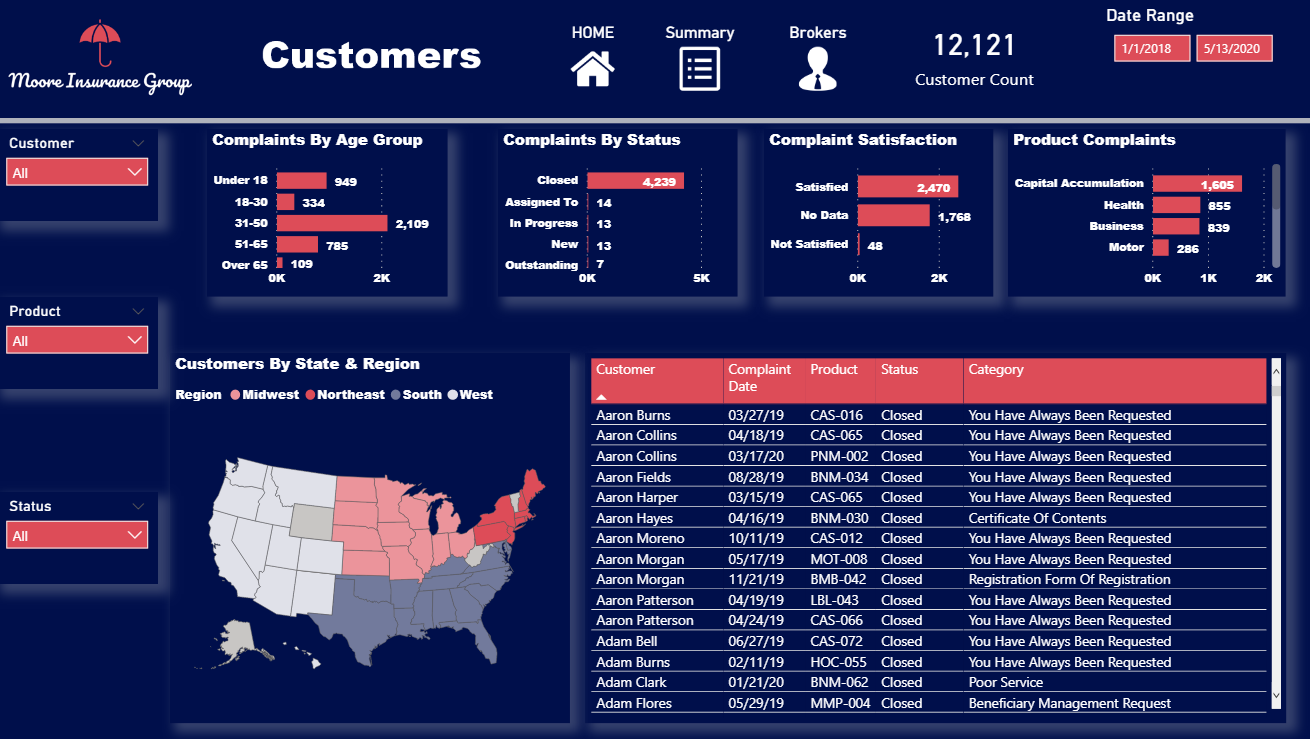
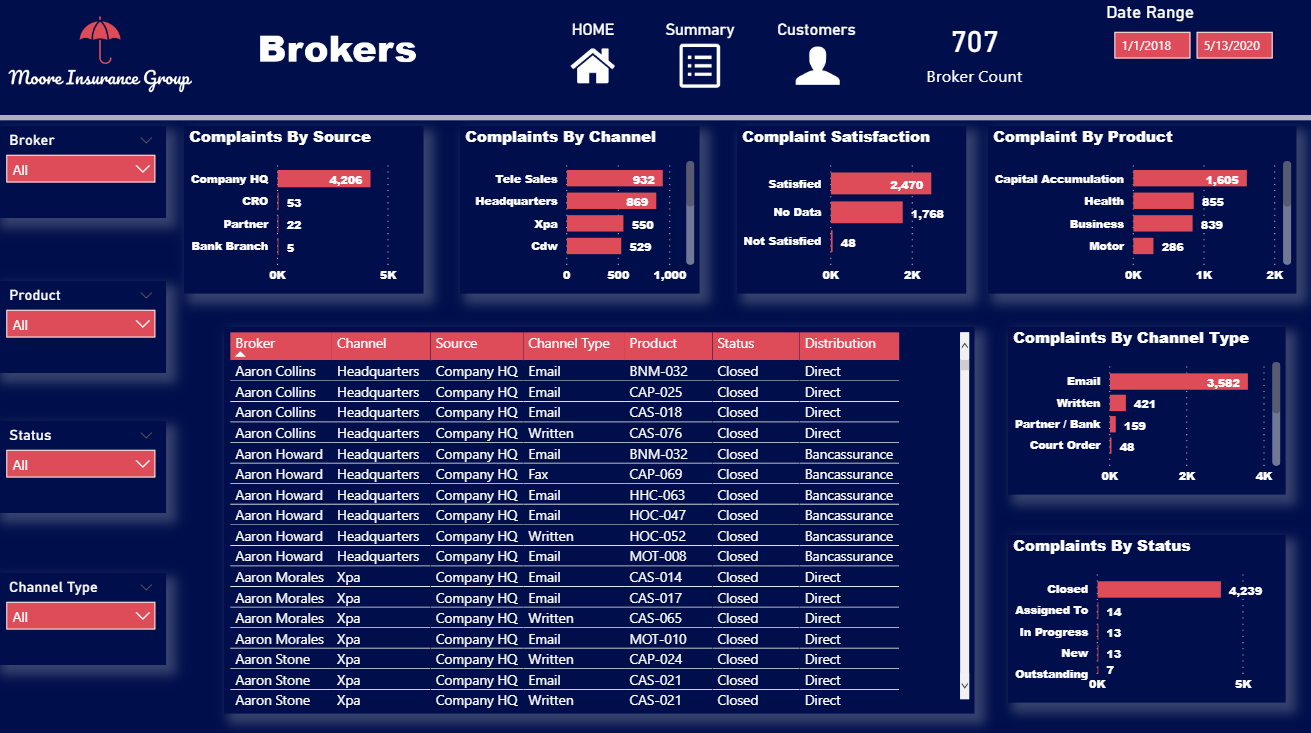
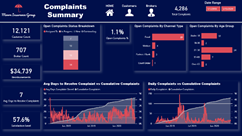
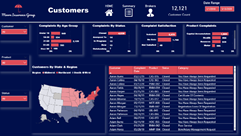
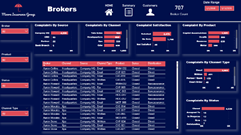
Here is Company Logo I chose for this challenge, as well a pictures of each of the slides.

Once I had the image picked out, I went to 2 different sites to pick out my color scheme:
-
https://analysthub.enterprisedna.co/colour-theme-generator
-
https://imagecolorpicker.com/
Then I go to https://themes.powerbi.tips/ and enter the hex codes that I got from the 2 previous sites, and download my JSON color theme file that it provides.
The next step I do is go over to Microsoft PowerPoint and design each of my slides. Once I have that completed, I then use each one of those pictures as the background for each of my slides. Here are the finished products of each of the slides:

Data Model
My approach to this was to keep it simple, but there were many complexities in this one.
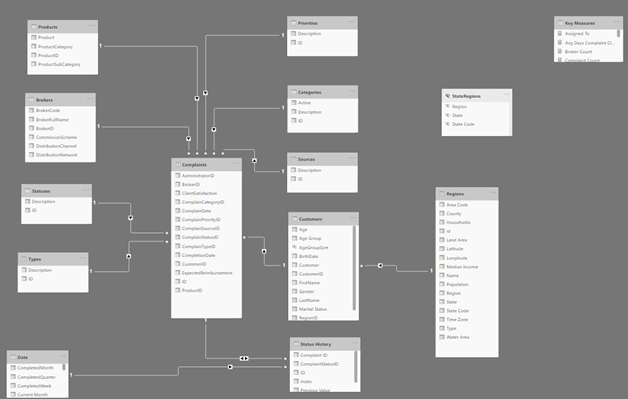
One of the first things I did was merge the data from the State Regions Table into the Regions Table. The trickiest relationship was between the Status History and Complaints Table. Went back and forth in a chat with Brian Julius & Greg Philps. The next step that I did was create most of my measures that were needed for the Key Measures Table.
Putting the Model together
This was the very last thing that I did. I tried on this challenge to have icons that did page navigation throughout. I had a home page where you could go to any other slide, but also included icons on every slide so that you could navigate back and forth with ease. I was pleased with how that turned out, and I have started using this more in models that I develop for clients.
Conclusion
Overall, this was probably the most difficult of challenges so far. Try not to get discouraged if you did not submit an entry for this challenge. This was a tough one to crack, especially if you are a newbie to Power BI. I really learned a lot from all the entries for this challenge. One thing I would suggest to everyone in these challenges is that it is fine to keep things simple, you do not need the big wow factor. In my opinion, many of the top entries are the ones that are simple, and easy to understand.
Cheers
Jarrett

