Hi all,
My primary focus this time was on solving the time duration per status. Coincidentally, this challenge ran parallel to a project at work where the status progress is monitored.
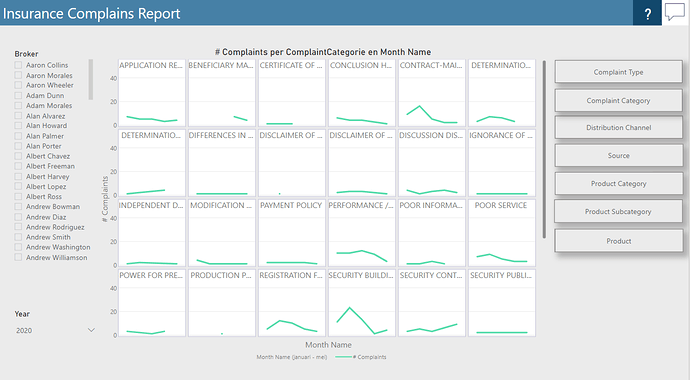
I also wanted to use small multiples to visualize the various dimensions. I don’t use so many custom visuals at work.
In addition I wanted to integrate a GIF file into a tooltip to explain certain steps to users.
My goal to dissolve more on the power query side was (again) not achieved due to lack of time. 
Visuals
I have used the custom visual ‘Small multiples’ and added hierarchies. I have bookmarked every level in the hierarchy and put them in buttons as an action. The visual became slow so I duplicated the page and split the number of data fields in the visual and this speeded things up. I have hidden the duplicated page, but it can be accessed by the bookmarks in the buttons. I have added a tooltip to show the geographic information. To prevent small multiples from being shown without data, I put a measure in the visual filter on condition = 1.
Check values in FACT = INT(NOT ISEMPTY(ComplainsData_Tbl))
(I use this method all the times and usually put it in slicers to avoid selections without results)
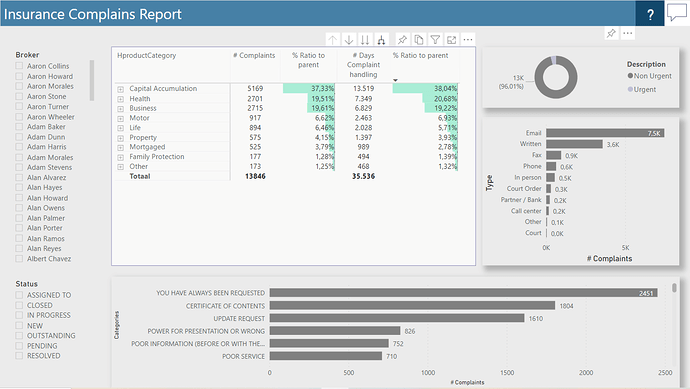
On the other page I created a matrix visual containing the categories, subcategories and products. In the matrix I display the ratio to parent for the amount of complaints and duration. I used the following measurements.
PercOnParent =
VAR CurrentAantal = [# IDs]
VAR PerSubCat =
CALCULATE ( [# IDs]; ALLSELECTED ( Products_Tbl[HSubCategory] ) )
VAR PerTotaal =
CALCULATE ( [# IDs]; ALLSELECTED ( Products_Tbl[HproductCategory] ) )
VAR RatioToParent =
IF (
ISINSCOPE ( Products_Tbl[HSubCategory] );
DIVIDE ( CurrentAantal; PerSubCat );
IF (
ISINSCOPE ( Products_Tbl[HProductCategory] );
DIVIDE ( CurrentAantal; PerTotaal )
)
)
RETURN
RatioToParent
In the measure you will notice the columns HProductCategory and SubCategory. These are calculated columns based on the columns ProductCategory and SubCategory. For the purpose of the measure I created these calculated columns to prevent the hierarchies from being unintentionally affected by incoming filters on the original ProductCategory and SubCategory columns.
For the ratio to parent of the duration I have used the same logic.
Power Query
Added Melissa’s Date table of course!
And…. Too little….
Tooltip with GIF
I recorded a few steps with Honeycam and turned it into a gif. Then I created a report tooltip page. In the page background of that page I have included the GIF-file. I have placed the tooltip above the matrix visual to show the user certain steps when hovering over the question mark.
Colors
I have used the eDNA color picker to get the desired palette from an image. That was very easy to use.
Bonus
I found the solution for the status durations for my project at work in this challenge. Although I have not visualized the progress of the individual statuses in this report I now understand how to create it. @Neba provided a solution that fits the requirements of my project at work in Power BI Challenge 6 - Insurance Complaints - #83 by Neba. Other participants gave me links to patterns that provide understanding. So thank you all!
These challenges are really great. Nowhere else outside of eDNA can you find this.
Daniel
eDNA CH6 DA.pbix (1.9 MB)


 ) Perhaps this will simplify SOME of that… Definitely checking out Honeycam (and a few other GIF software options)
 I’ll look into it - I haven’t paid much attention to Snagit because I have an open source clipping tool that I really like (Greenshot).