Here’s Amdi’s entry for Power BI Challenge 6. @Amdi, feel free to add other details of your work.
Here’s how Amdi described it:
DATAMODEL
There was a lot of dimension. In the excel file from sheet Complaint Data I when through all the dimensions sheet to find which column could be linked to sheet Complaint Data.
Then I found that Sheet Regions and State Regions had connection to the customer and not Sheet Complain Data.
In the beginning of my process I thought the main Fact table was Complaint Data and the table Status History Data should have link to Table Complaint Data.
Afterwards I realize that all the dimensions from Complaint Data should be merge to Status History Data and table Status History Data had also record on claims which still where in process.
QUERY
The table Regions in some of the columns, had also Underscore between the words. I could handle it manually but looks in M code to see how this should be handled if there was a lot of tables with this issue. Because there was no function in Power query to handle this.
I came to this M-code.
“= Table.TransformColumnNames(#“Changed Type”,each if Text.Contains( ," ")
then Text.Replace( ," “,” ") else _)”.
This M-code look for the Underscore and if not, it leaves the column.There was a function to change word where, so the first word starts with Capital letter. I used that afterwards on column name.
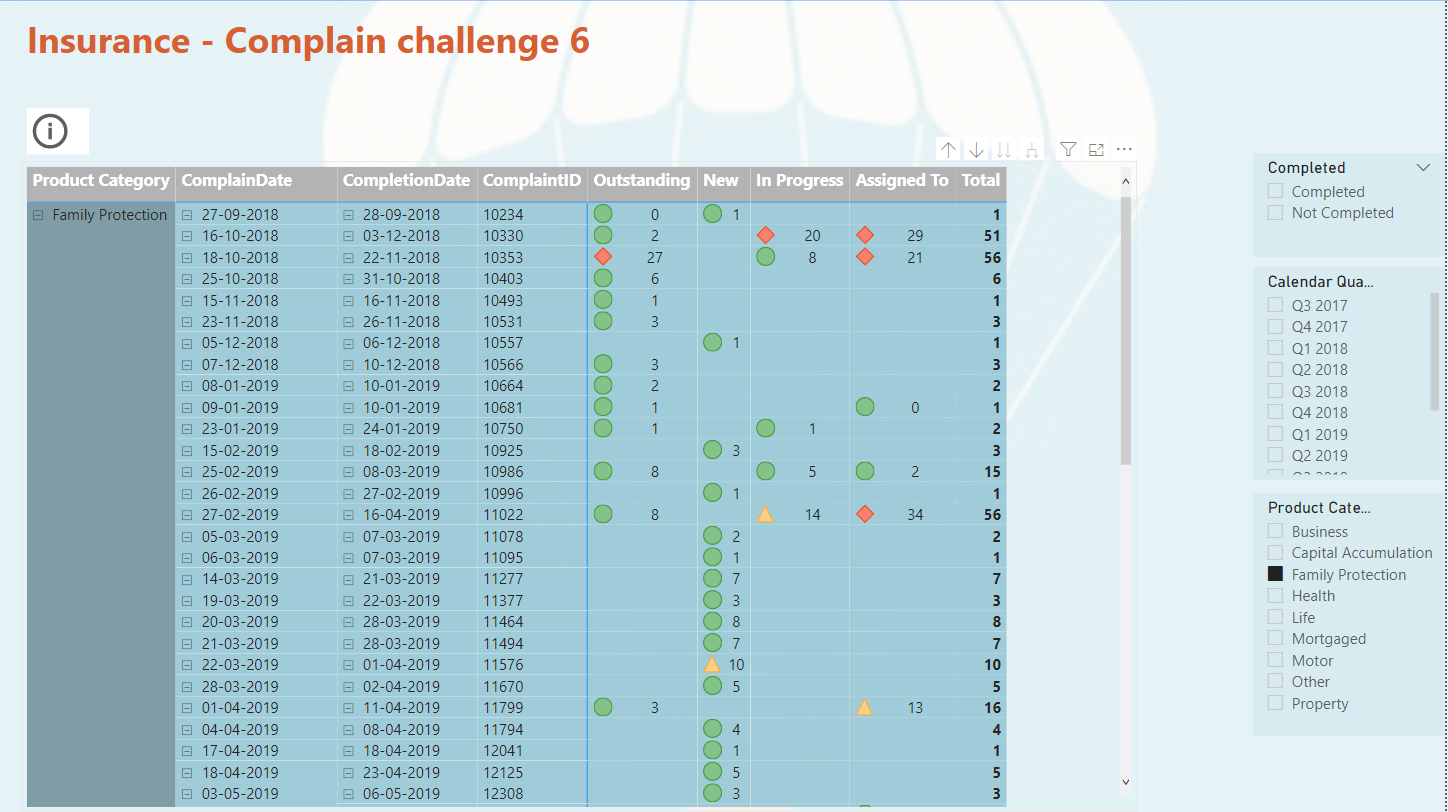
MEASURES AND CALCULATED COLUMNS
I did only make one measure it was DISTINCTCOUNT to count number of claims.
What I found interesting was to show how many days a claim was in each status. In last challenge 5 with eyes I would also like to calculate how much have the ex. Left eyes change from last time. Could not solve that.
This time I solved it. Each claim has many records for each status and a date for when the claim started the new status. I had to Range each claimID limited to the each ClaimID. Afterwards calculate the dates between to days. So, Rank 1 Status Start days 2019-01-15 and Rank 2 Status Start days 2019-01-20. So, Rank 1 status has then been on its status up to the day where Rank 2 status get its start date.
Remembered that I have read something about this issue. Now I found it SQLBI.COM. I used RANK as calculate column and then LOOKUPVALUE as calculate column. The calculated columns is placed in table Status History Data.
There is one issue. If the user gives a claim two different status on the same date. So, Rank 1 have two different status and up to Rank 2 the days will be counted twice.
I would say this could be an issue for the Internal Audit, as it should not be allowed. If change status on a date where it already has a status. The right way should be changing the status on an already record on the date.
I also decided that below 1o days in one status was fine. < 10 Green, < 20 Yellow, >= Red.
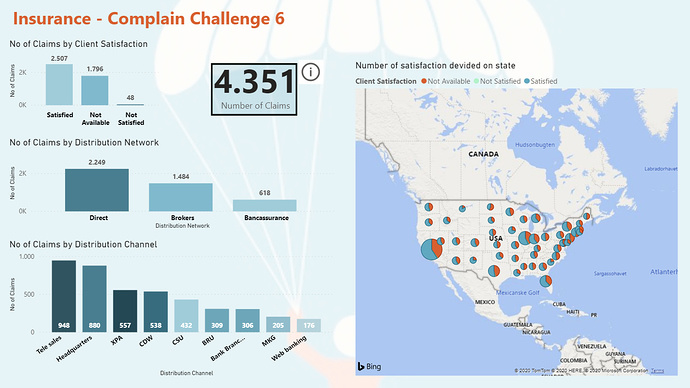
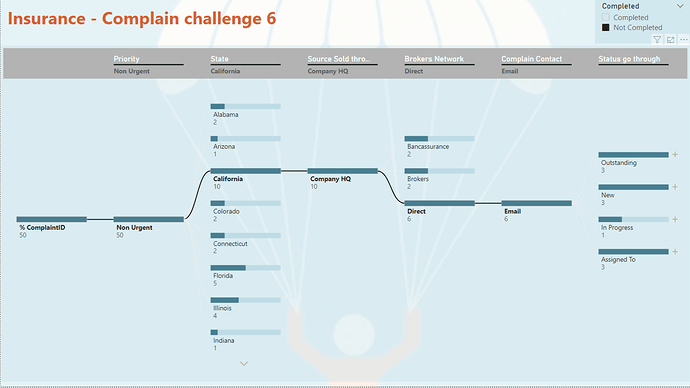
VISUALIZATION
One factor we should consider was “Complaints broken down by the dimensions”. I find there was so many dimensions and not all I know what means.
I decided to show this as a Decomposition Tree Visualization, so the user can decide what to look at.
To learn about the real-life scenario presented for the challenge, be sure to click on the image below.
