Here’s the entry from one of our non-member participants, Amal.
Here’s how Amal described it:
My report covers data for the last two years.
It is divided into 6 pages with a home page that navigates to the other report pages.
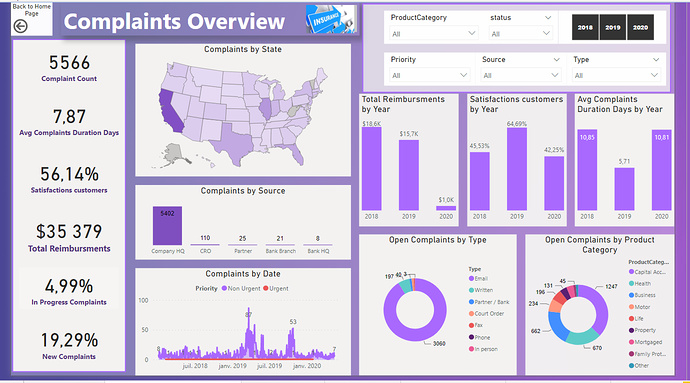
The first page of the “Insurance Complaints Overview” report gives us a global view of the company’s insurance data, with KPI indicators: number of complaints, average duration taken to process complaints, percentage of clients satisfied, total reimbursements, percentage of new complaints or in progress complaints.
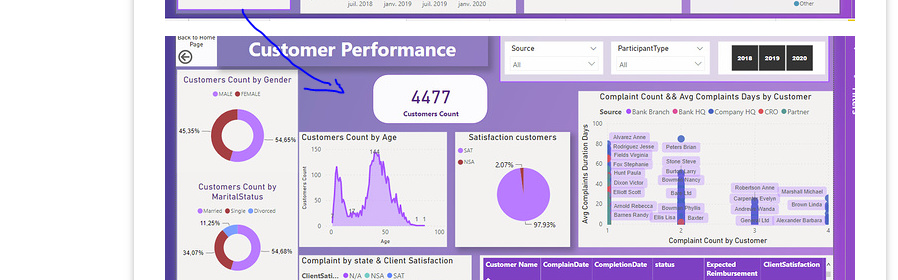
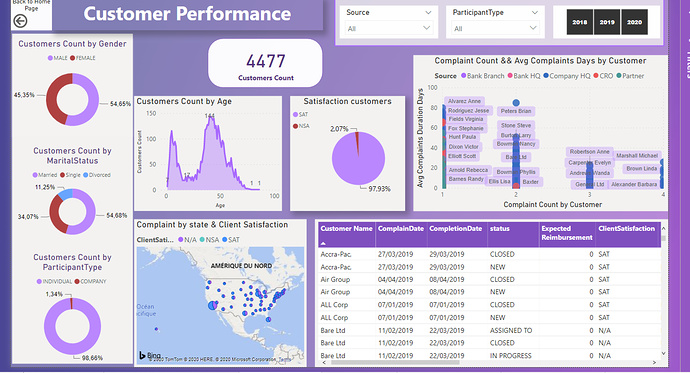
Other visuals show complaints by state, by source, by date, product category, by type of complaint.A second page dedicated to customer details “Customer Performance”, in which I detailed the personal information concerning customers and I calculate their distribution by age, gender, social status.
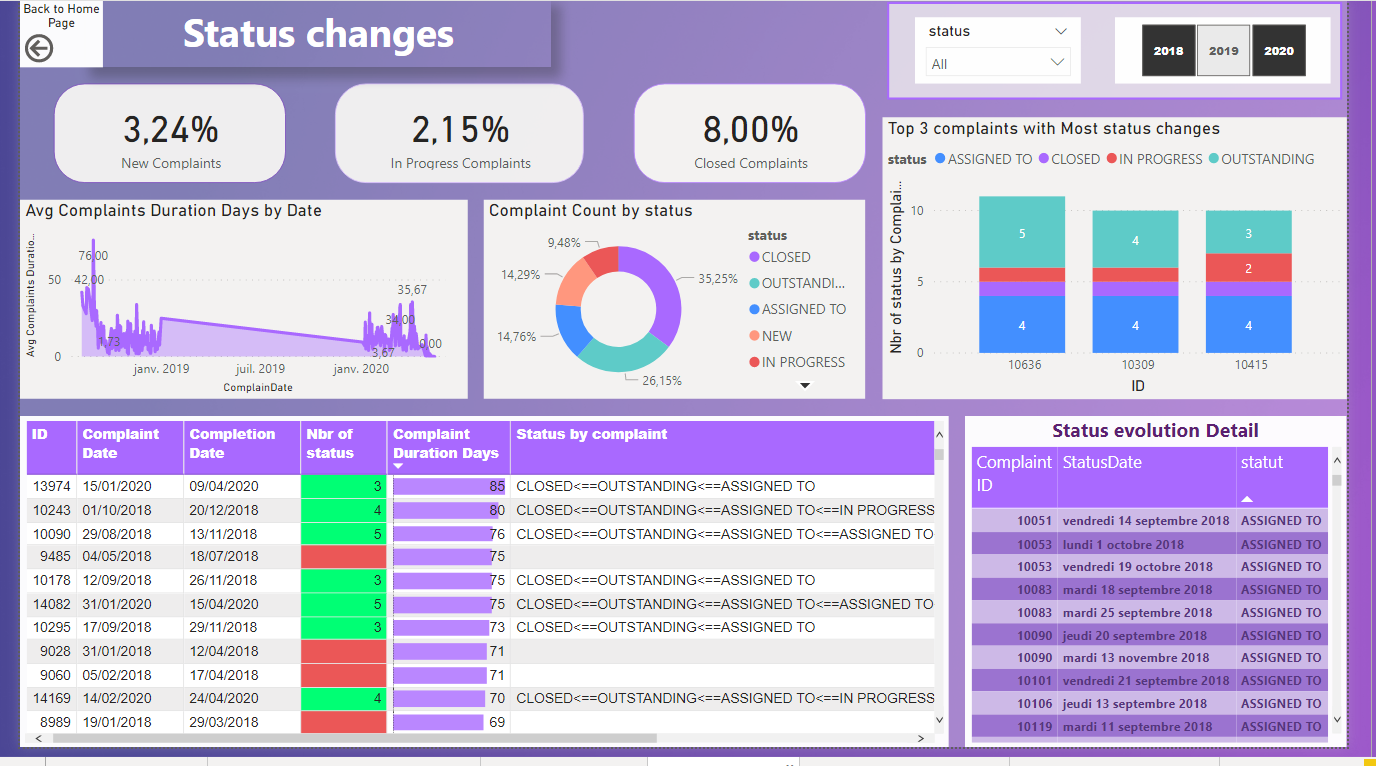
I also processed their satisfaction in a pie chart visual and displayed in a scatter chart, the correlation between the number of complaints and the duration of complaint handling for each customer“Complaints status changes” page from which I calculated the number of statuses , the duration in days for each complaint and I detail the evolution of the status associated with a complaint.
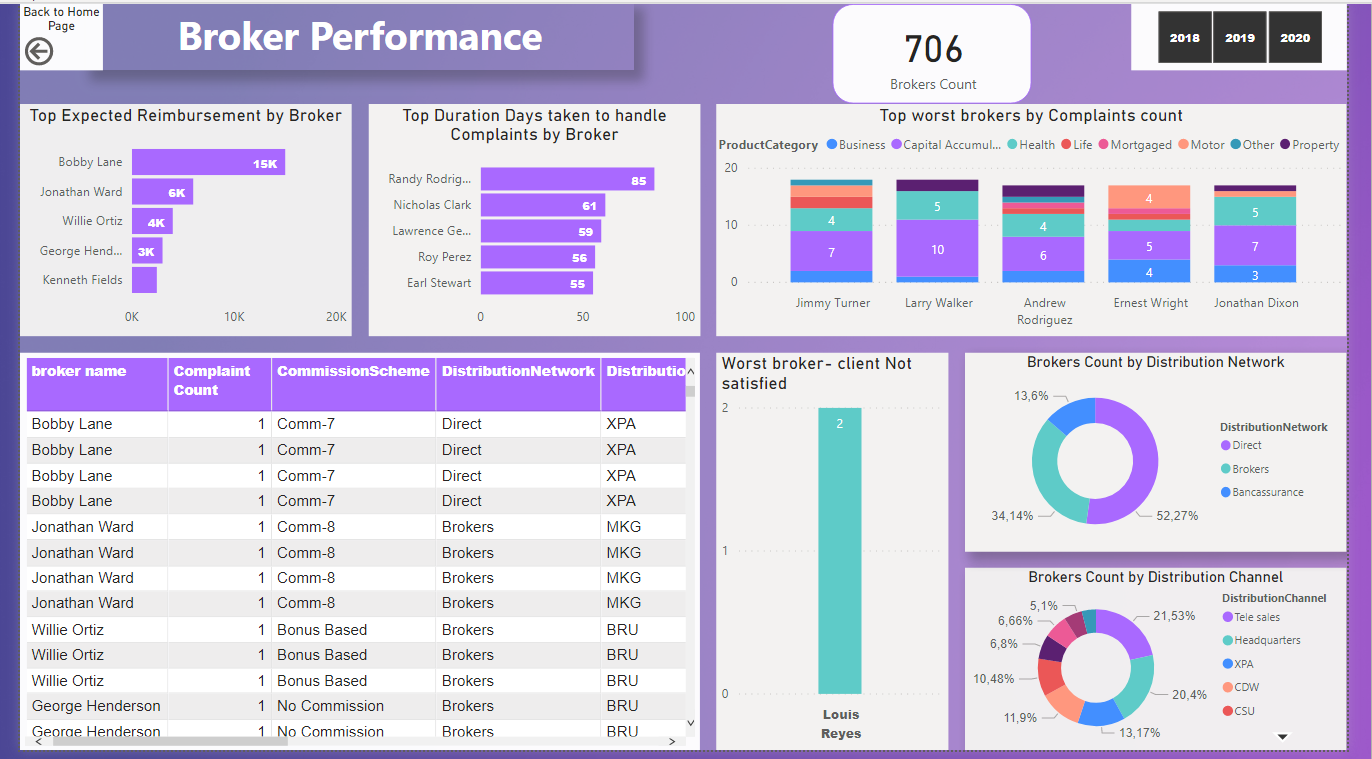
I have prepared for this, two different tables for complaint details and complaint status history. it is by choosing a complaint in the complaints details table that you will see the history details on the other table.In the “Broker Performance” page, I tried to focus on the worst brokers in terms of complaint management: for example, I displayed those with more complaints, with more number of customer unsatisfied, or those who take much longer to handle complaints
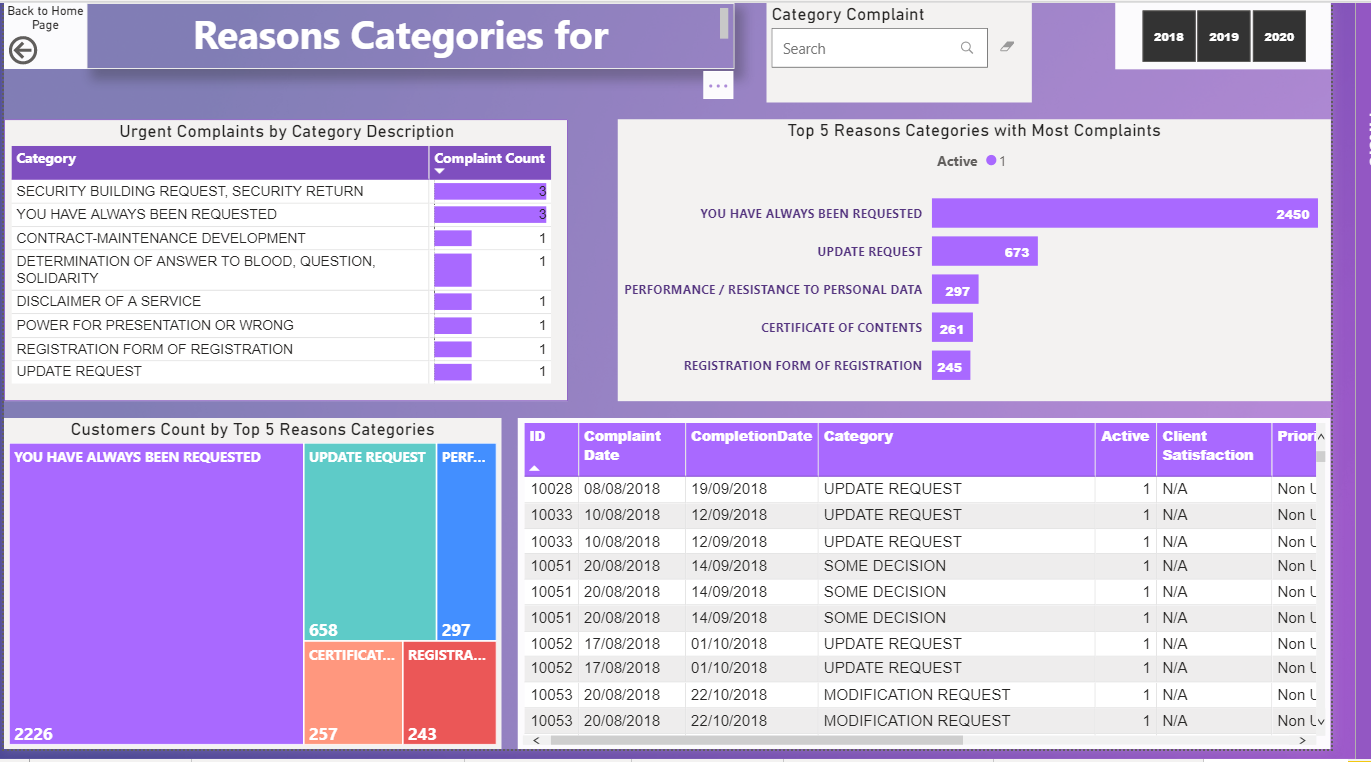
The “Reasons for Complaints” page details the categories of complaints, and I tried to highlight the categories with the highest number of complaints.
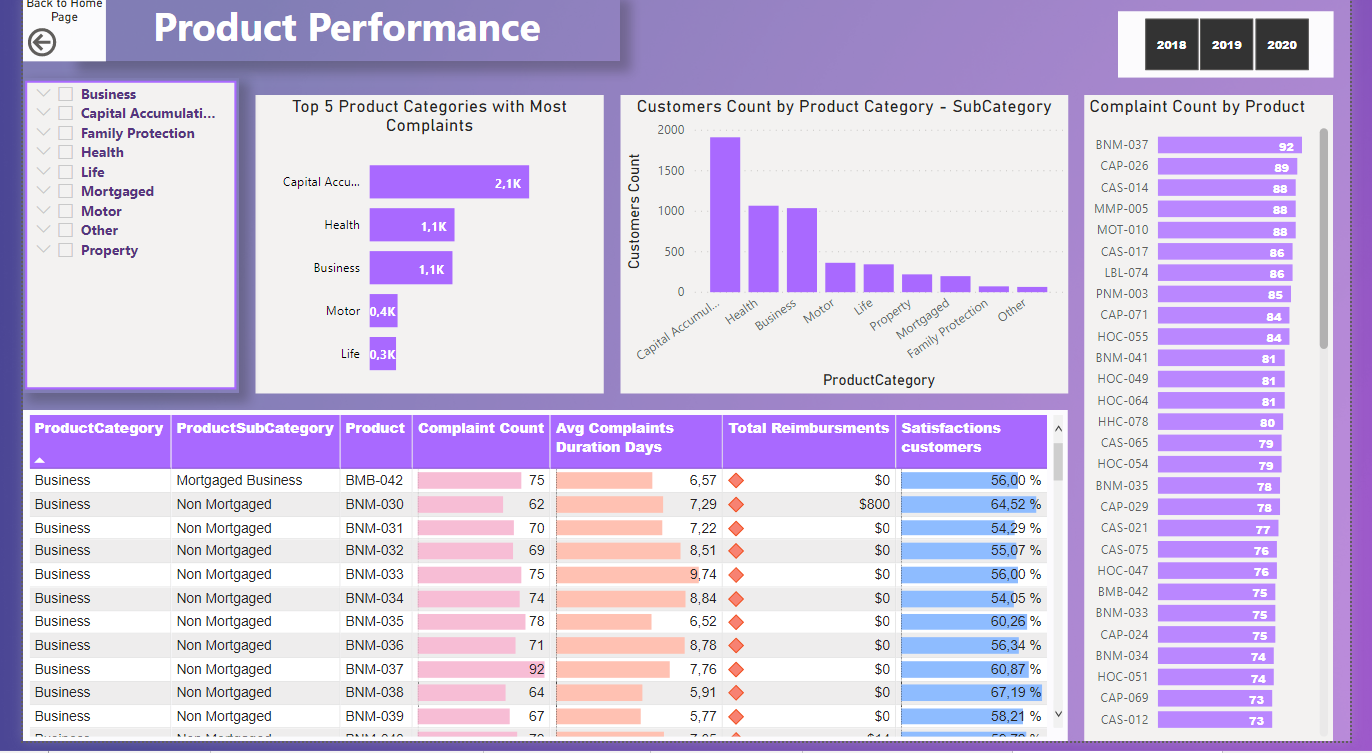
In the “Type Product Insurance” page, I detailed the complaints by category, sub-category and product.
I showed for example the top 5 categories with most complaints and other very relevant visuals for decision making.
To learn about the real-life scenario presented for the challenge, be sure to click on the image below.