Here’s Wally Campbell’s entry for Power BI Challenge 5. @Wally, would you like to share how you built this dashboard and what your inspiration is in building it?
To learn about the real-life scenario presented for the challenge, be sure to click on the image below.

Hi @Wally, great work on your submission, we really love to hear your inspiration. Let us know who you went about creating this submission. Thanks!
Well done on your submission Wally.
You’ve gone really out there with a brown palette. I really like your risk taking, so well done. Personally I maybe would have gone with a slightly more lively colour and then variations on that. So maybe have a think about using some of the colour theme generator colours for next time.
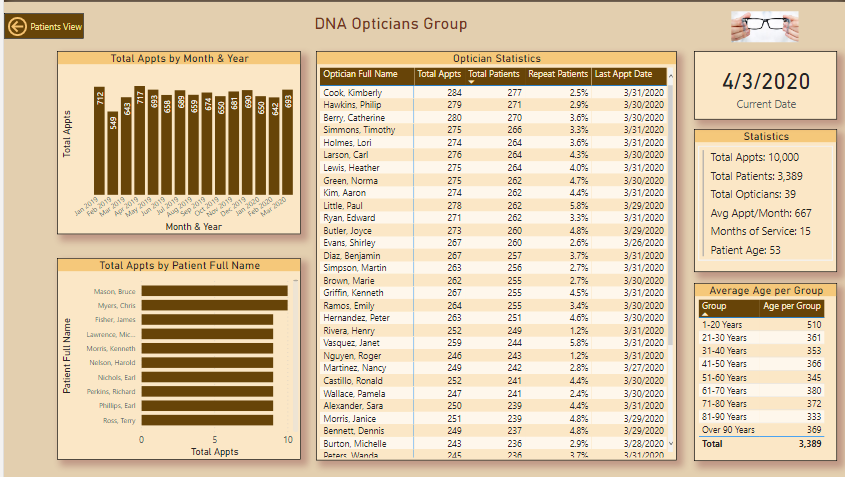
You definitely covered all the brief here, and made it easy for the consumer to navigate round to interesting insights.
The only thing I would maybe suggest here is try to challenge yourself a bit more creatively. Maybe use some of the other great features embedded into power BI, like tooltips, drill through, bookmarks, page navigations, custom visuals maybe.
There’s just so much variety that you can embed into your reports so it just takes a bit of imagination and testing yourself and you can create something incredibly compelling.
Sam