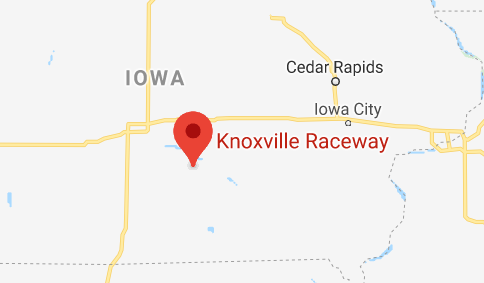
FYI - Knoxville is in Tennessee,
- Brian
Thanks @BrianJ. ![]()
I am unaware of US states and cities and searched Knoxville Raceway.
Anyways, I see the Warehouse and the StoreCode in the Delivery Table , so have deleted my post.
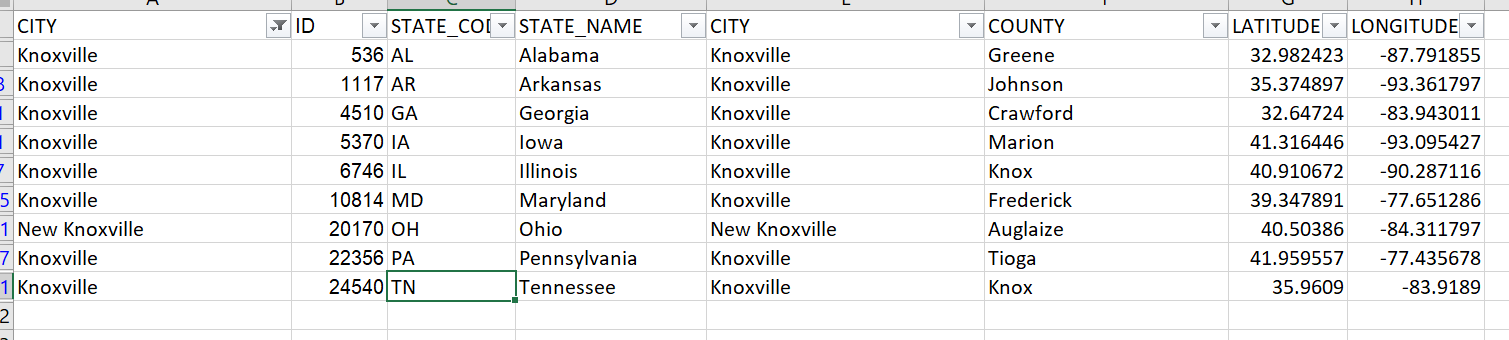
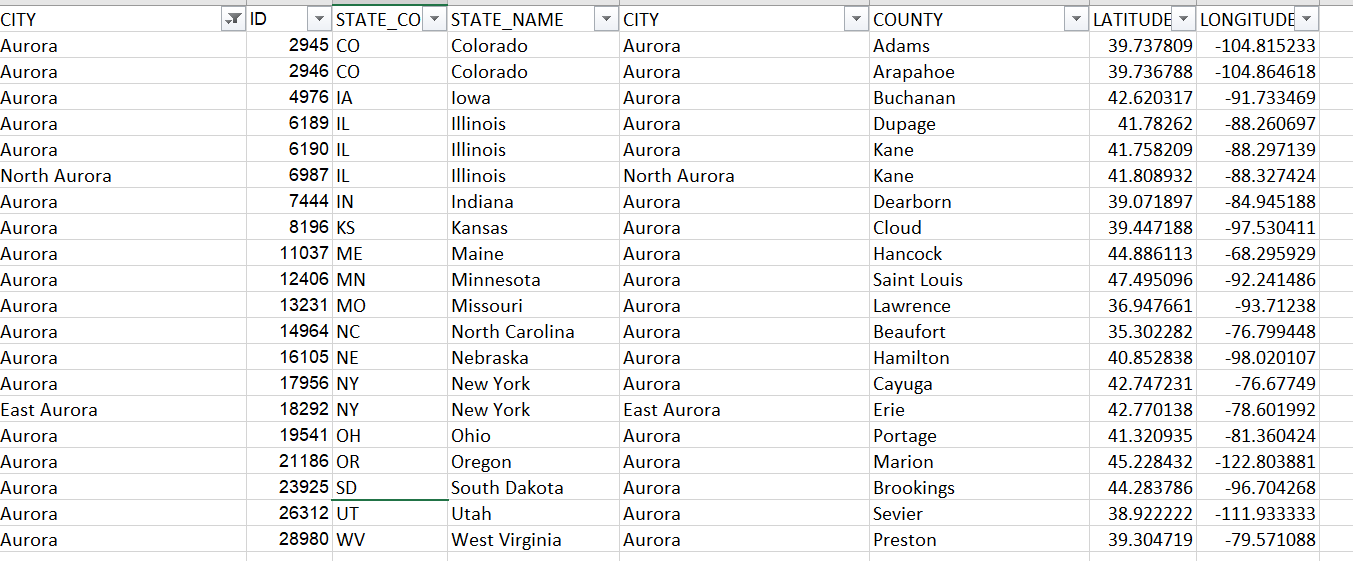
Also, have dowloaded the us city database. This is what I get.
Confused as to which should be considered. Idea here is to check if they have to cross state borders for deliveries.
Any suggestion from where should I download the US City and State Data.
Have used this currently.
https://raw.githubusercontent.com/kelvins/US-Cities-Database/master/csv/us_cities.csv
Regards,
Harsh Nathani
Any suggestion from where should I download the US City and State Data.
I haven’t gotten that far yet. Still trying to make sense of the warehouse-store pairings and durations. My only conclusion thus far is that their whole business model is wrong - they should stop delivering packages entirely and focus on licensing their technology for teleportation… 
I found a nice, clean city database file from simplemaps.com:
It’s free, but you have to agree to cite the source in your report.
Hope this is helpful.
Hi @BrianJ,
Thanks. 
But this link re-directs you to the same link which I have posted.
Regards,
Harsh Nathani
“But this link re-directs you to the same link which I have posted.”
Sorry – I’m not seeing that. When I click on the link I provided and scroll halfway down, there’s the option to download the free data set, which is different than the one you provided:
Hi Brian
If I download, i have to be agreed with:
" Use of the free database in production requires that you link back to:
https://simplemaps.com/data/us-cities .
What shall I do if I use it ?
I can’t understand it.
/Amdi
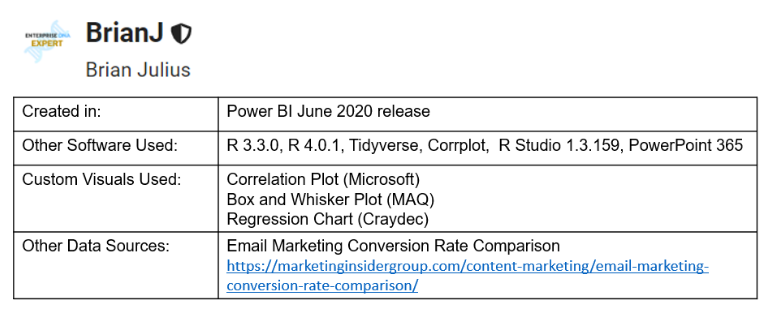
I think just including a small note at the bottom of the page linking back to the source is fine. For my reports, I typically include an information page at the end, listing any additional data, custom visuals, supporting programs I used to create the report. I was going to put the link there. Here’s an example from my report on Challenge #2:
Of course, if you don’t want to bother with the citation, there are tons of other free city database sources. I just happened to like the layout and content of this one…
I hope that’s helpful.
Challenge accepted
Hi All,
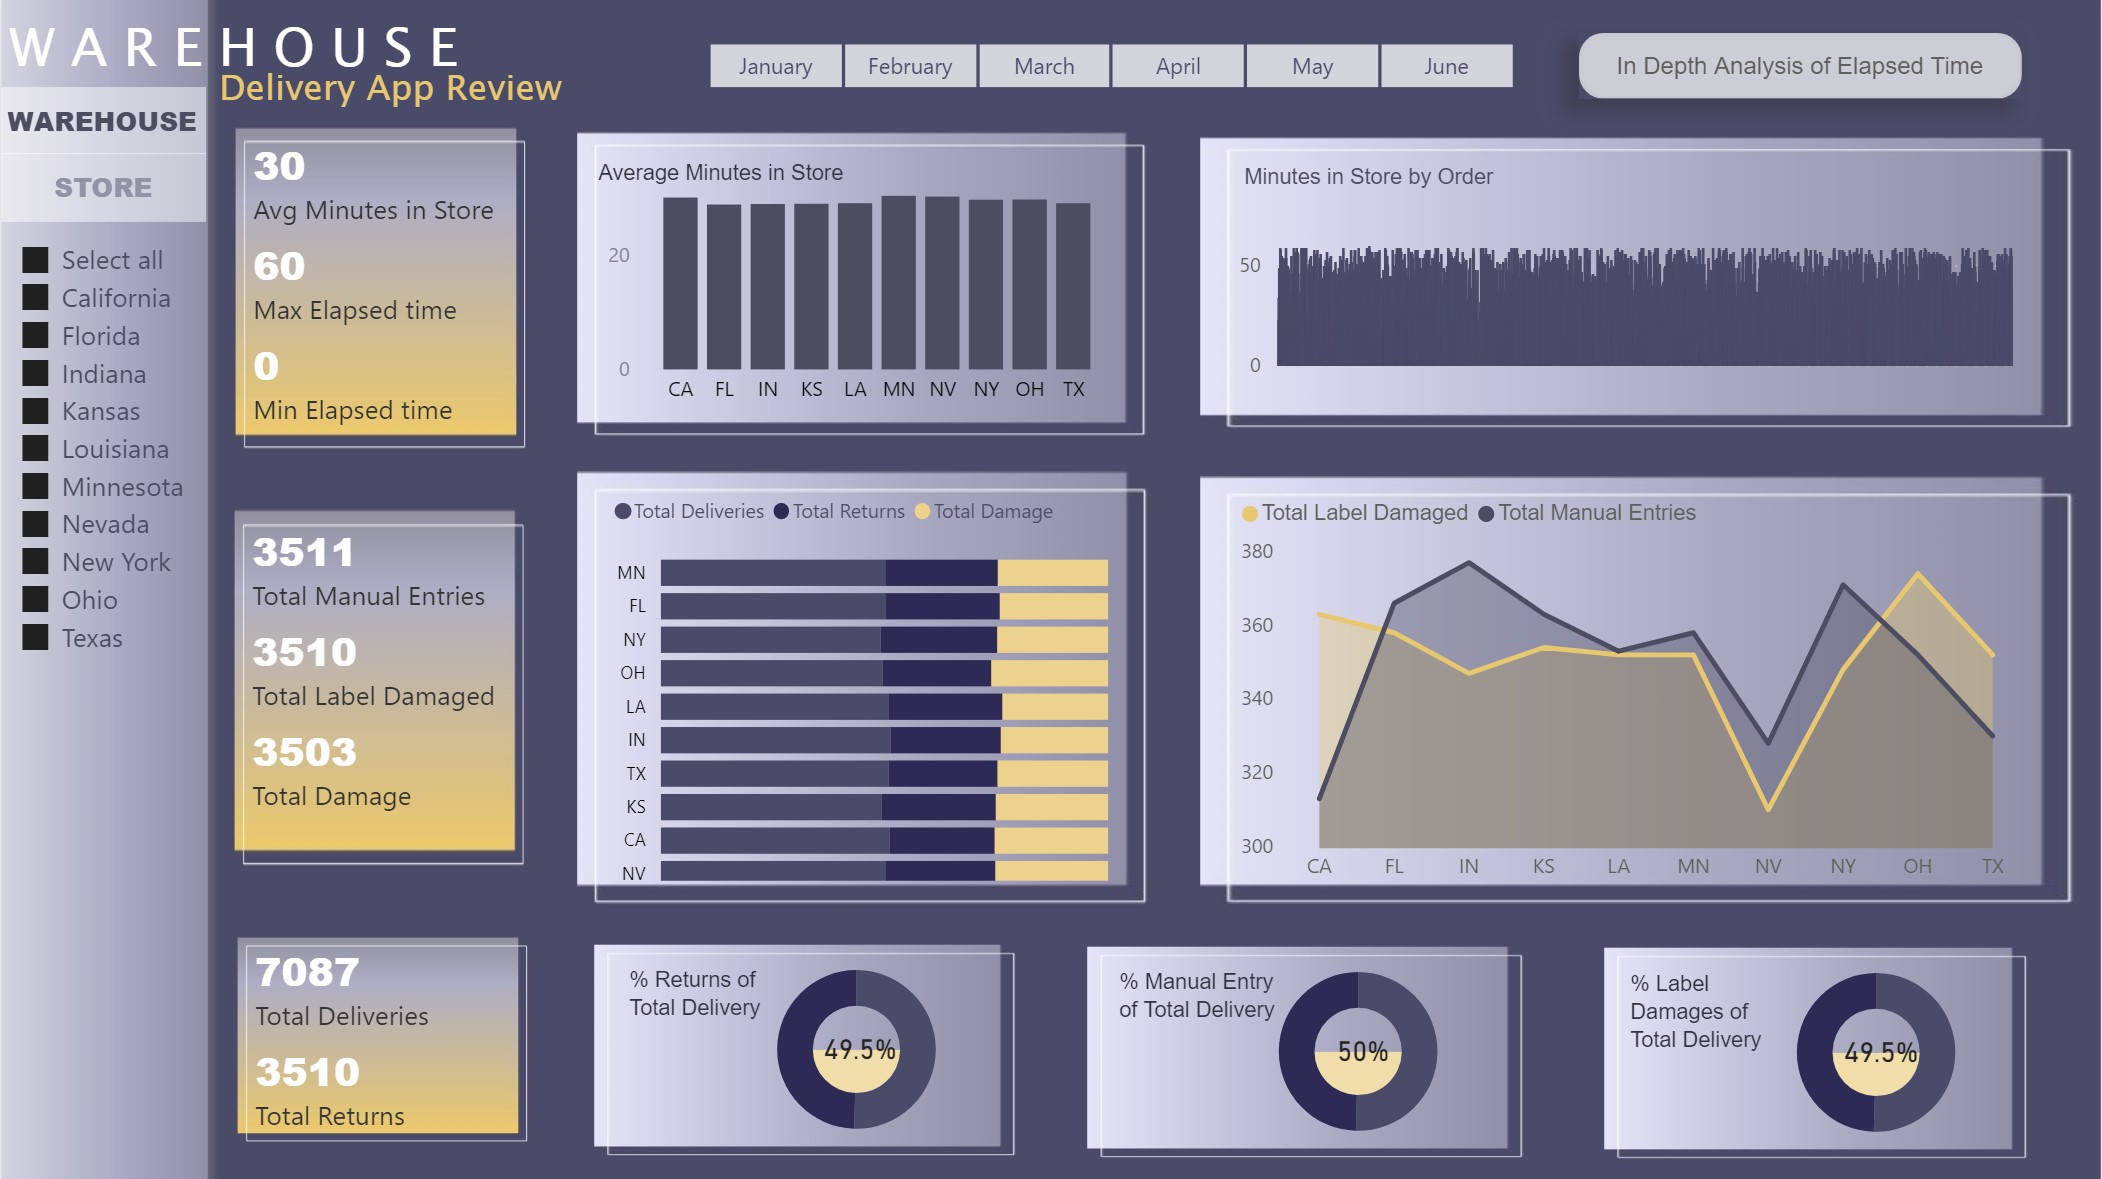
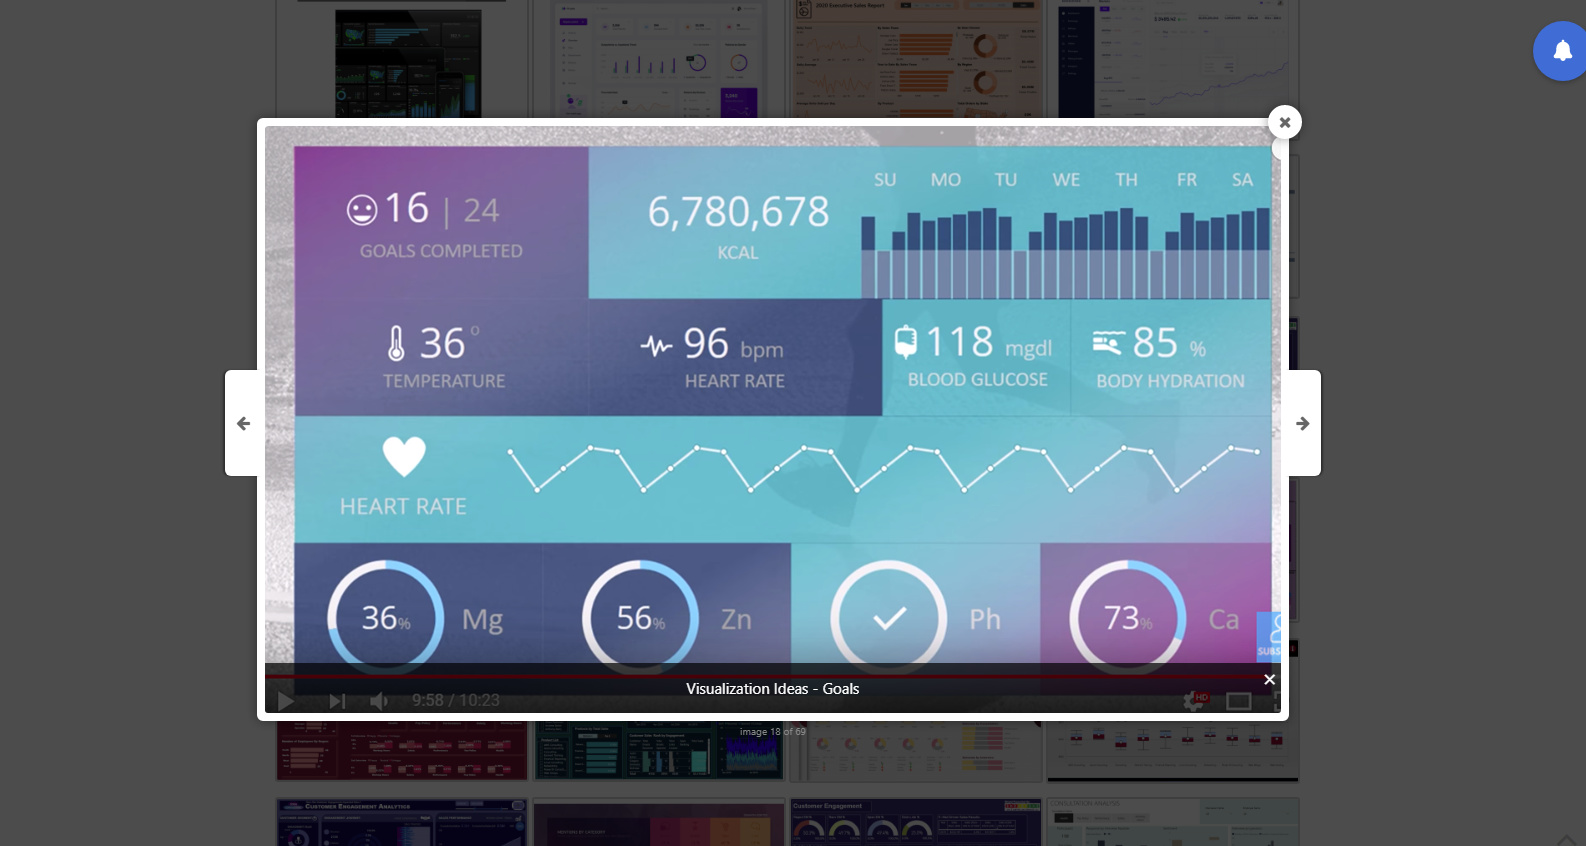
This time I create my report thinking in the things I wanted to learn in Power BI.
I wanted to use:
I also attached a video of the report running
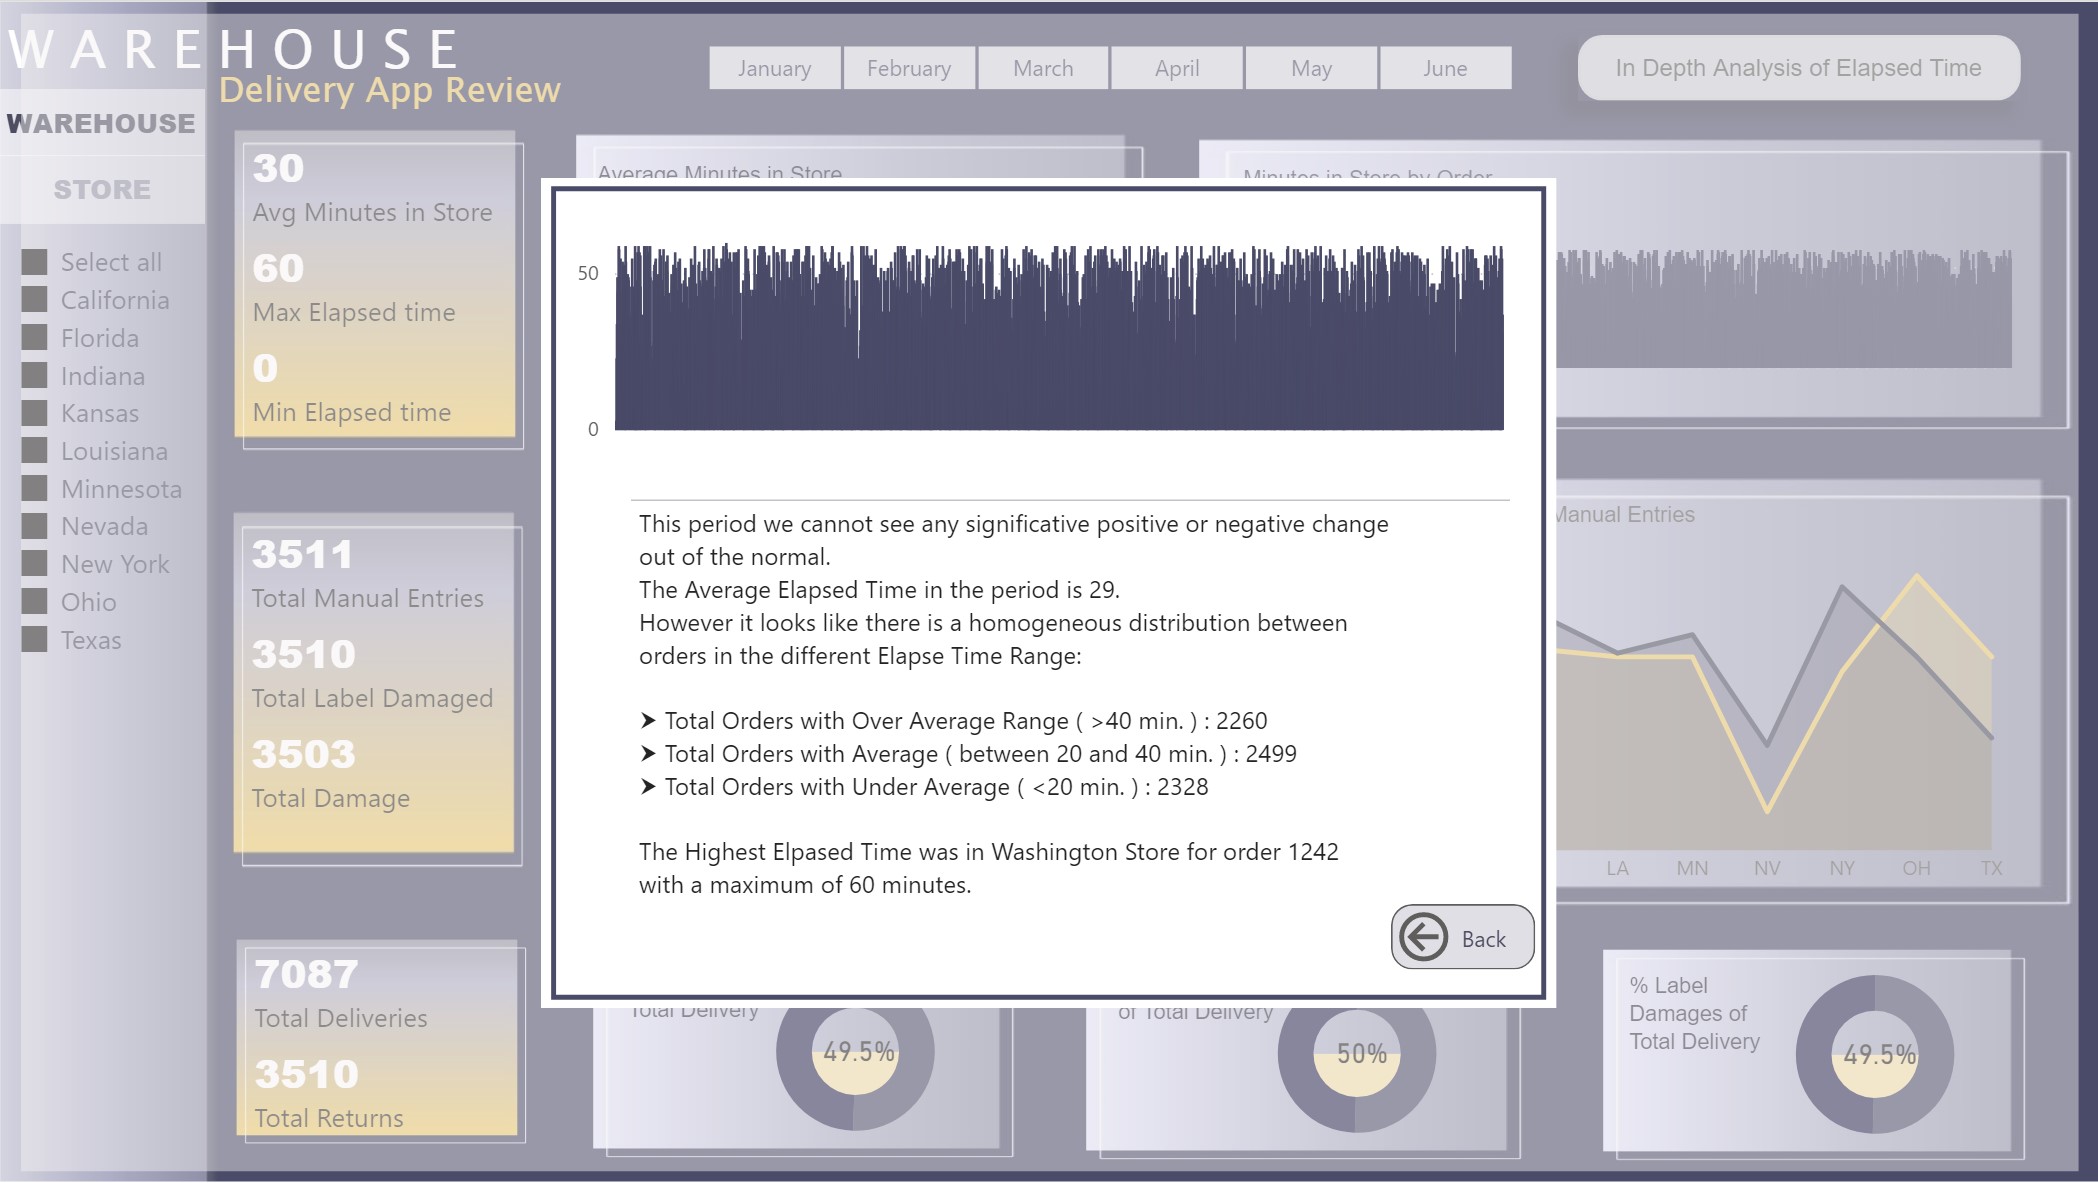
QUESTION!!! I could not figure out how to get the store with the highest elapsed time in a measure, I wrote the name, but I wanted to have it dynamic. If some one has a suggestion, I will appreciate your comments.
I create a write up of the report in Challenge 4- Delivery App Data Entry from DianaB
Please let me know if you have any question or comments and suggestions to improve my report.
Thanks,
Diana
Nice work. Like the design
Hi All,
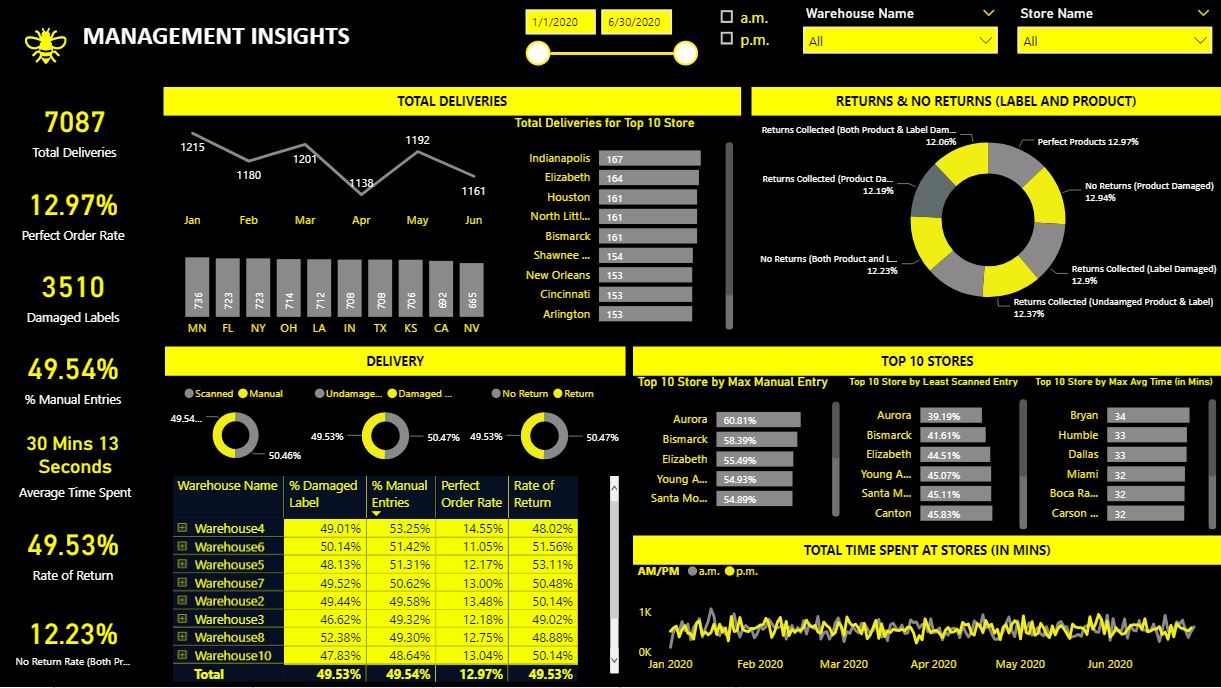
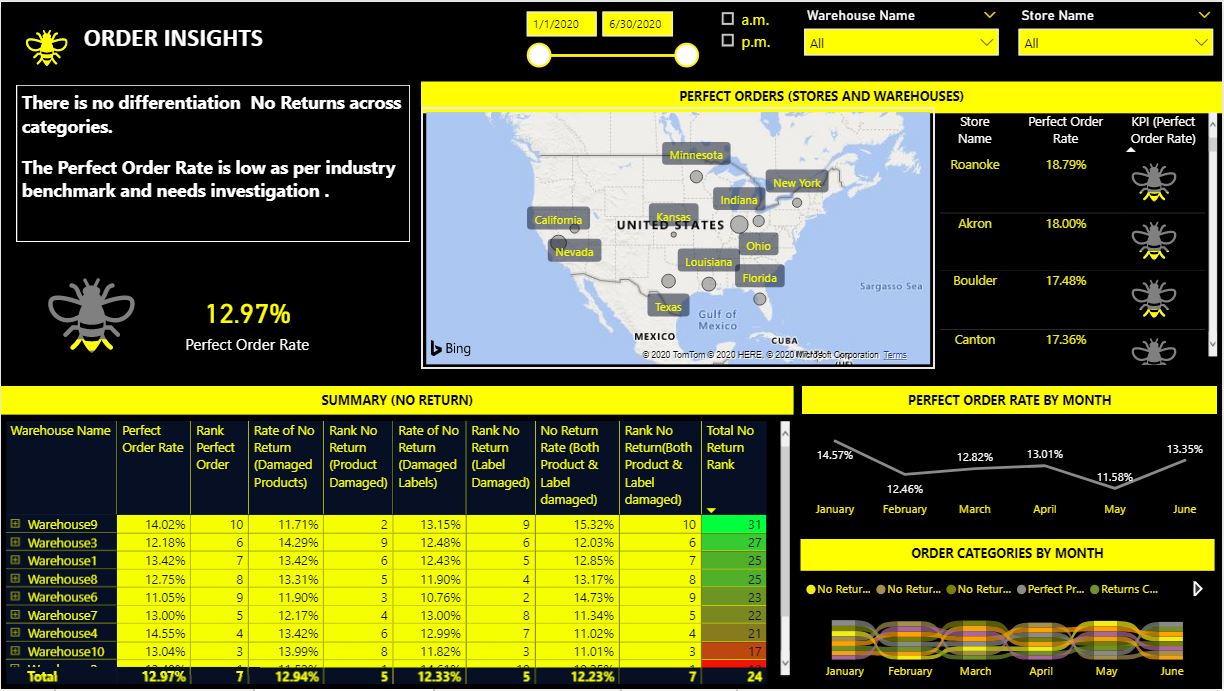
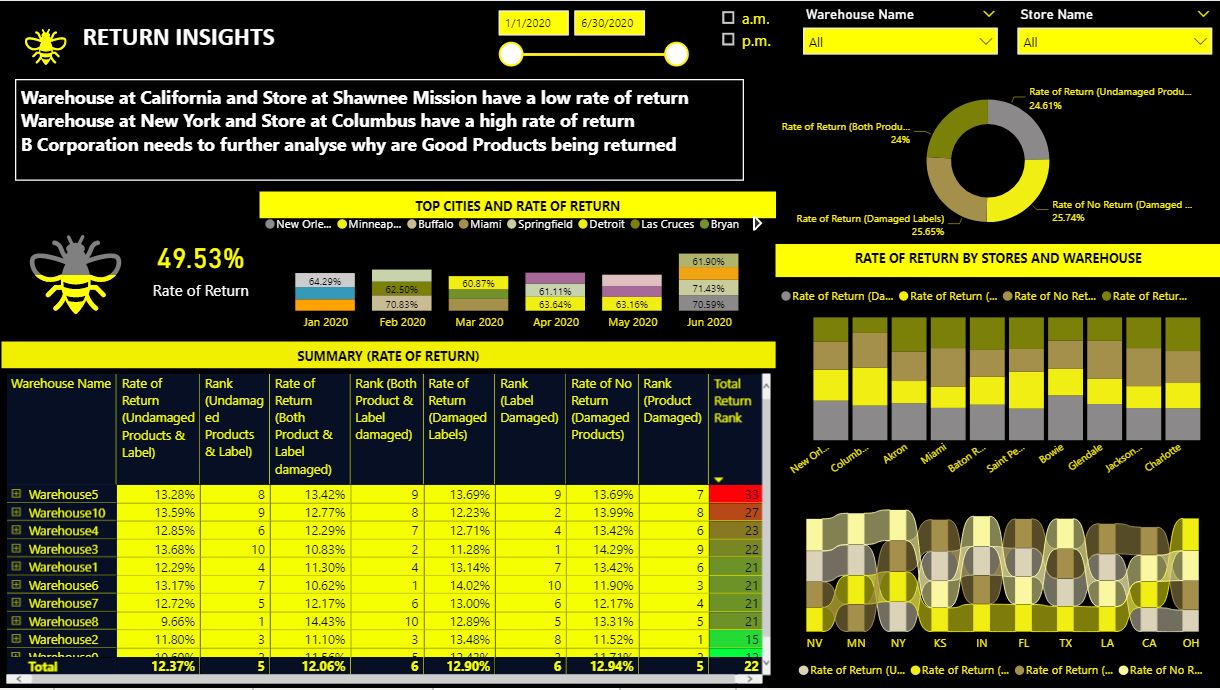
Please find the snapshot for my submission.
I would like to Thank @sam.mckay for all the tutorials on Power BI.
I have tried using SVG from the blog (https://hatfullofdata.blog/) for filling up the bees according to their %ages.
Tried to create a bee template.
Do let me know your views and suggestion on the visualization.
Regards,
Harsh Nathani
Great work @harsh.nathani a really nice looking report.
I didn’t think id be so drawn to a black and yellow theme.
Cant wait to have a play with it and get into the detail.
Haroon
Thanks @haroonali1000.
I have mailed the report at powerbichallenge@enterprisedna.co
Just wanted to confirm whether we receive an acknowledgement mail after we submit the challenge.
Regards,
Harsh Nathani
Looking forward to submitting my report later today!
I recording the whole thing also, so will release it on Enterprise DNA TV in the coming days
Sam
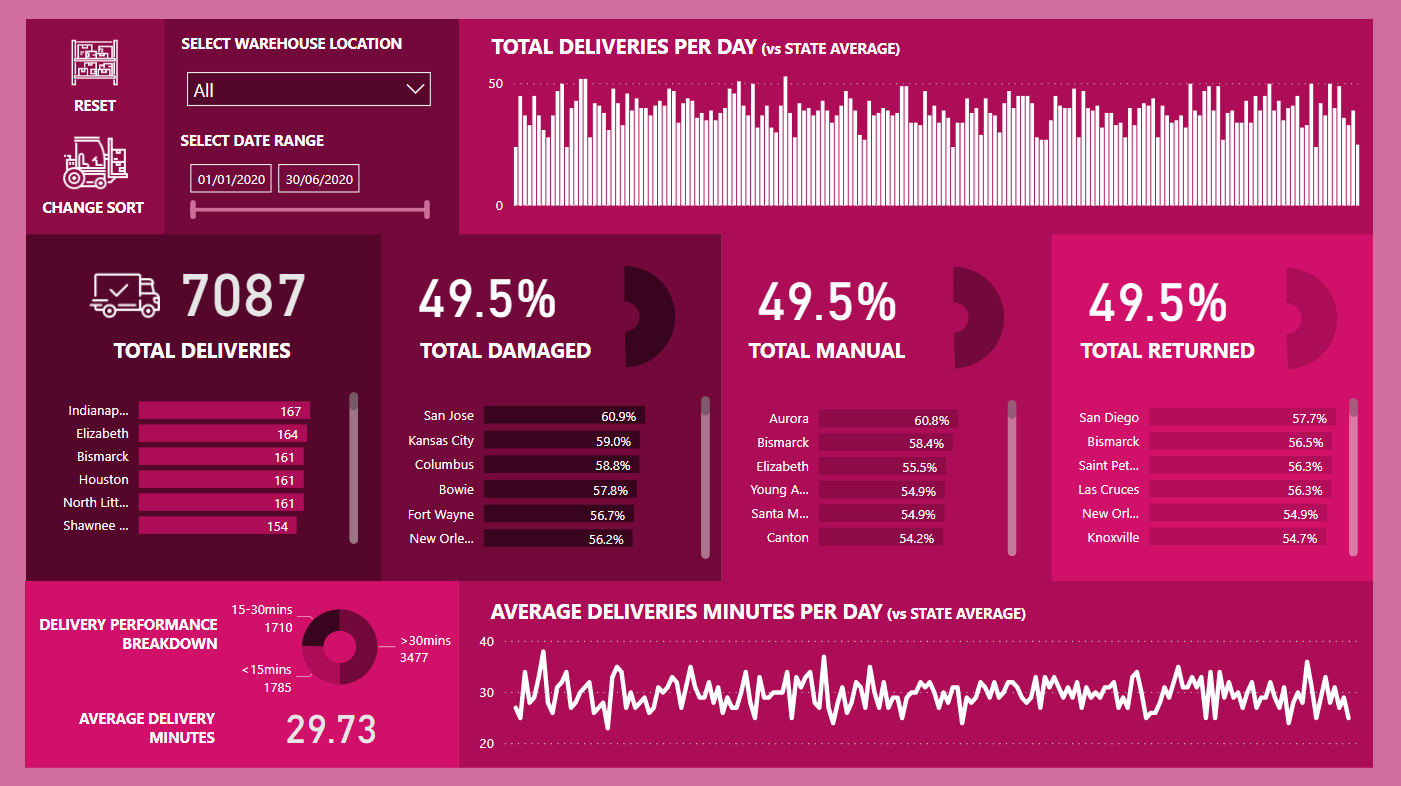
I’m done. Here’s my submission
I’ve really gone out there with my visualization and challenged myself to do something different. The visual part of the challenge took me the longest time, just working out what would look good together.
I took inspiration for the report design inspiration section of our knowledge base.
https://info.enterprisedna.co/report-design-inspiration/
You can have a play around with the report here
I’ve embedded a few navigation additions to the report with the icons which makes it easier to find certain insights.
Let me know what you think!
I’ll do a bigger run down in the project updates section early next week.
I’ve also recorded most of the development so will be placing that on youtube shortly also
Sam
 . I never would’ve imagined that visual scheme would work, but it really does. It’s striking, but not to the point of detracting/distracting from the analysis itself.
The report design inspiration gallery is also really developing well as more and more of these challenges produce great submissions.
Working on getting mine finalized over the next day or so and look forward to posting it, and can’t wait to see the other entries…