Hi All
Trust that you are all well.
Another amazing effort from all participants on challenge 2. The entries were of an impeccable standard and the implementation of techniques and principles was great to see.
The number of people participating is growing, which is great to see, its open to everyone whether you’re a seasoned veteran or new beginner it’s a great opportunity to learn and grow. So please feel free to invite others to join (even if they don’t have membership they can participate).
It was great to see feedback, tips and tricks being shared in the forum and that’s what the whole challenge is about. Collaboration between individuals trying to master their Power BI skills.
The challenge is all about what you make of it and there are some great opportunities to enhance your profile.
Sam created a detailed post about the steps he took in his development and it would be great to see this from more of you. Any questions around this shout!
I believe we can be sharing more about how we went about the project. Share ideas and get feedback on how we can get better at our work in Power BI.
The Winner
Picking the winner this week was no easy feat there were some outstanding submissions. There were some great colour schemes, layouts and some excellent use of calculations.
The winner is………@BrianJ. Well done Brian a truly awesome report that covers all aspects. I’m sure there are a few of us who will be keeping something like this up our sleeve for future reference.
There were some highly commended efforts from @neba, @michaelsampsonidis, @walter and @DianaB.
Honestly a massive well done to all participants I really enjoyed reviewing your submissions.
Feedback
This was another typical ask that many developers will find coming their way.
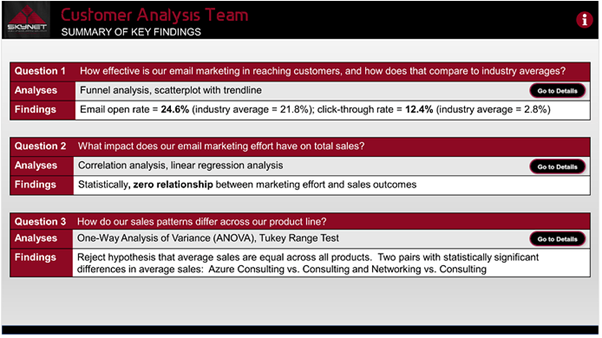
The Challenge was all about combining two different data sources and evaluating the results.
Overall the quality of submissions was super high, and you all did an amazing job at extrapolating what was required from the brief.
The key to this task was to establish a relationship between the two data sets.
The creation of one unique table containing customer details was key to this Sam covered this in his webinar so be sure to check it out.
There were some other subtle hints in the brief this week and I want to take a moment to reflect on those.
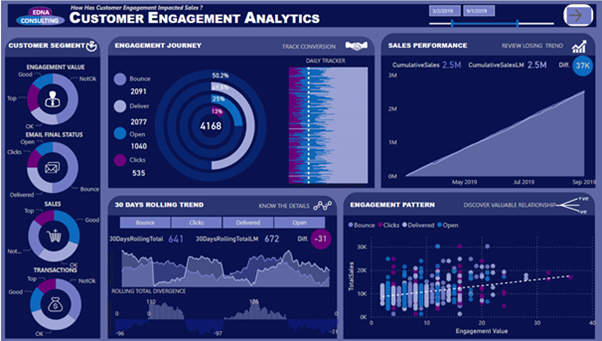
Janet is an engagement manger so one of the key things she will be looking for is the metrics around engagement and how you as an analyst can represent that into something meaningful.
It was great to see that many of you created an engagement metric if you didn’t, I would investigate this. Sam covered it in his video and it’s a great technique to be aware of and very common in industry.
The other key thing around this challenge was to compare Sales Vs Engagement I think several of you missed a trick by not comparing the sales value per customer to their engagement metric. Sam created a couple of great visualisations demonstrating this.
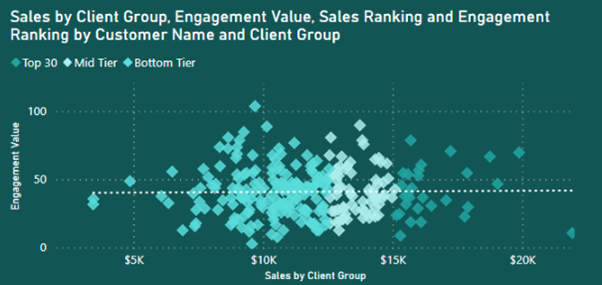
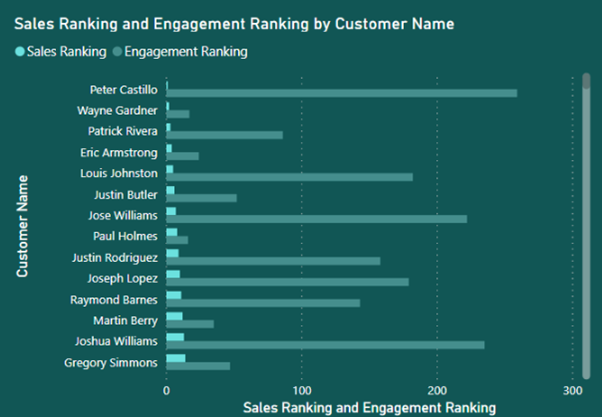
There was nothing fancy about the techniques he used and I’m sure many of you could easily incorporate this into your reports, but it was key to meeting the brief.
The use of a consistent and professional colour schemes was great to see.
So just want to say a massive well done to everyone who took part in the challenge and producing a great report.
Hints Tips Tricks
I have recently been working extensively with customer/client data on a project and came across a particular technique that fits in nicely with this challenge and hopefully some of you will find useful in your work.
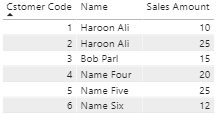
When working with person identifiable data it’s not uncommon that there will be multiple customers with the same name. Take the example below there are two customers named Haroon Ali. They have the same name however a different code and are therefore two distinct customers with different sales history.
If we remove the customer code, then Power BI merges the two customers giving a false representation of the figures. Looking at the following table:
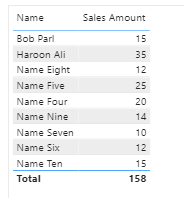
You would assume that Haroon Ali has spent $35. However this is not the case as this number is the sum of purchases made by two different customers with the same name. The query generated by Power BI groups the above table by customer name. If two customers have the same name, they are shown as a single customer.
One solution is to concatenate the customer code and name to guarantee that customer names are always unique however the result is sometimes a little unruly and not easy to read.
The technique I want to share with you is so that you don’t end up with these ugly looking columns in your report!
We can utilise a very powerful character from the Unicode set known as Zero-width space.
Zero-width space are special characters that affect how to print words used in some writing systems, we are not interested in their usage for printing but the fact that they are invisible to the eye.
The idea is that if we add Zero-width space to the second Haroon Ali it looks the same as the first Haroon Ali but will in fact contain a hidden space at the end and is therefore different.
Hmm well what if we have more than two customers with the same name? Fear not DAX can help us.
We create a new calculated column for customer name where we append the original name and a suitable number of Zero-width spaces to guarantee that no matter what the customer name is unique.
The first step is to identify the customers with the same name, rank them using the customer code and then add spaces respectively: zero space for the first, one space to the second, two spaces to the third etc. The general rule of thumb is that once we have the ranking position of the customer we add as many zeros as the ranking minus one. The DAX pattern below implements this technique
NameUnique =
VAR CustomersWithSameName = CALCULATETABLE(
    SUMMARIZE( Customer, Customer[Customer Code], Customer[Name] ),
    ALLEXCEPT( Customer, Customer[Name] )
)
VAR Ranking = RANKX( CustomersWithSameName, Customer[Customer Code],, ASC, DENSE )
VAR Blanks = REPT( UNICHAR( 8204 ), Ranking - 1 )
VAR Result = Customer[Name] & Blanks

RETURN
Result
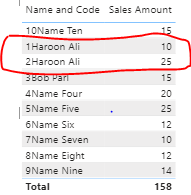
The resulting column is identical to the original name column for human eyes however DAX sees the results differently because of the Zero-width spaces at the end of the name.
As you can see in the result below placing the new column results in Haroon Ali being displayed in two separate rows despite having the same name.
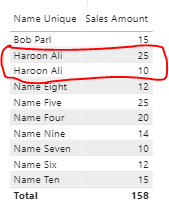
To ensure a smooth user experience it would make sense to keep the newly created column and hide the original column so there is no confusion to the user.
This technique can be extrapolated to any situation where two or more entities of the same type have the same name.
A more detailed explanation can be found here.
A cool technique to be aware of.
Conclusion
A great effort from everyone and thank you to all those participating.
Please remember the challenge is all about you guys and helping you in your development if you have any ideas, concerns, issues or anything else you want to discuss then don’t hesitate to get in touch.
Feel free to email powerbichallenge@enterprisedna.co for any queries or reach out to me personally on haroon.ali@enterprisedna.co
Ok that’s enough from me.
Keep your eyes peeled for challenge 3 which will be released soon.
Any questions, requests or queries do not hesitate to get in touch.
Haroon


 amazing!