Okay, I absolutely love what you’ve done here and with a couple of suggested changes, I think this one would be a home run.
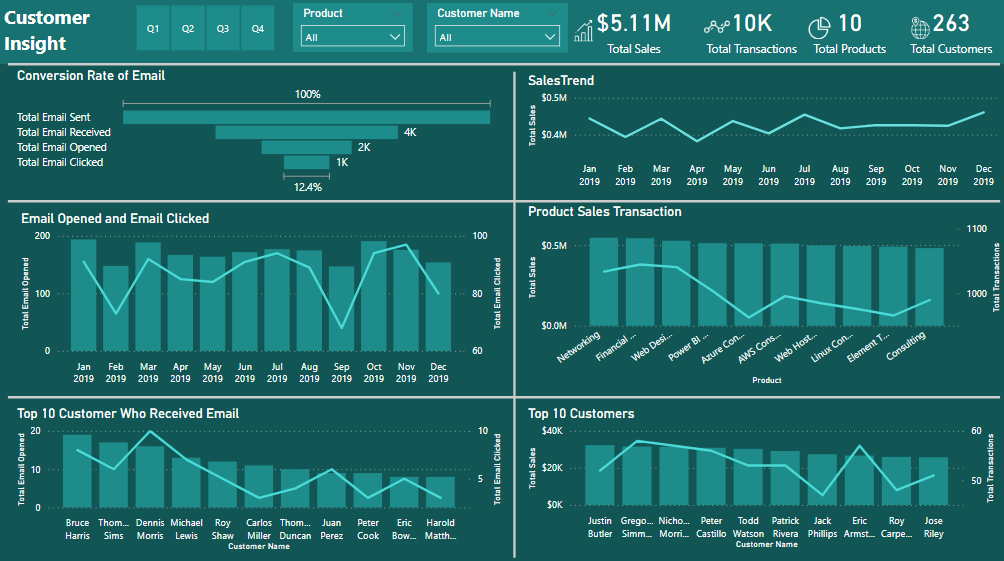
in my opinion, the information on the second page should be up front on the first page. This is really insightful, actionable information that will have significant impact on the business operations.
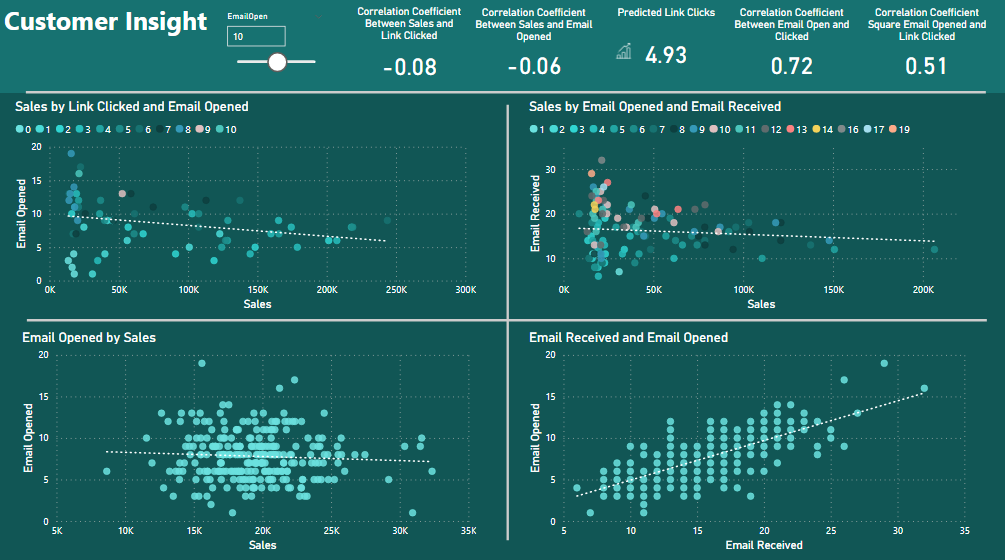
Dynamically computing the trendlines, correlation coefficients and predicted openings is outstanding. The key information missing that would fully complete the story are the significance levels of the correlation coefficients (i.e., is the relationship between these variables significantly different from zero?). While this is a snap using R within Power BI (which would also let you produce some very cool correlation matrix visuals), it’s actually not that difficult to do via DAX. Here’s the formula for the test statistic, where r is your correlation coefficient, and N is your number of observations.
You can then use the T.DIST.2T, T.DIST or T.DIST.RT functions (depending on the nature of your alternative hypothesis) to determine the p value and then just compare that to your critical value (usually 0.05) to determine significance or not.
Thank you for your input, will change the page as suggested. First I had build a Page 1 with Email on left and then sales on right. But I found no link between both and I remember reading on the challenge the the main part of this challenge was to find a relation between sales and email so I explored more to show the pattern in the second page. I read about your post as well which was really informative and has helped me in finding some insights.
Will try your suggestion of test statistics both with R ( sure will take help of your post for my learning ) and also with DAX.
. Feel free to give a shout if you have questions as you implement these approaches.
Again, huge kudos for challenging yourself in this way and being open to feedback. I guarantee you will make rapid progress this way, and really look forward to seeing your entries in future challenges.


 ) and also with DAX.
 . Feel free to give a shout if you have questions as you implement these approaches.