Power BI Builds 2 - Customer Insight

Challenge 2- Customer Insight

So here it is all the 2nd instalment of the EDNA challenge.

Remember its open to everyone so don’t be afraid to get stuck in.

To learn more about the challenge and how it works be sure to check out the forum below!

If you’re not sure of anything just reach out to me.

https://forum.enterprisedna.co/t/about-the-power-bi-challenges-category/7619/2

Welcome to the EDNA data challenge. An opportunity to enhance your Power BI development and learning curve. Sharing, learning and growing! Join us bi-weekly for a new scenario based on what you are likely to face in the real world. We take a data set and turn it into an actionable report providing information and insight. The Enterprise DNA community will then come together to review the project and would love for you to join us. So How Does It Work? Join the EDNA Challenge an awesome com…

Remember: The weekly winner will receive a complimentary membership to the platform that they can share with anyone and the opportunity for your work to be showcased across our channels.

THE BRIEF
You are an analyst working closely with the customer team.

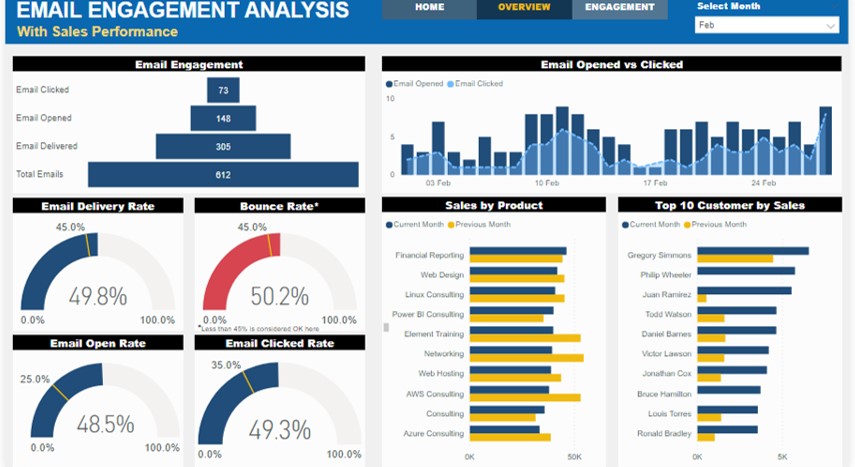
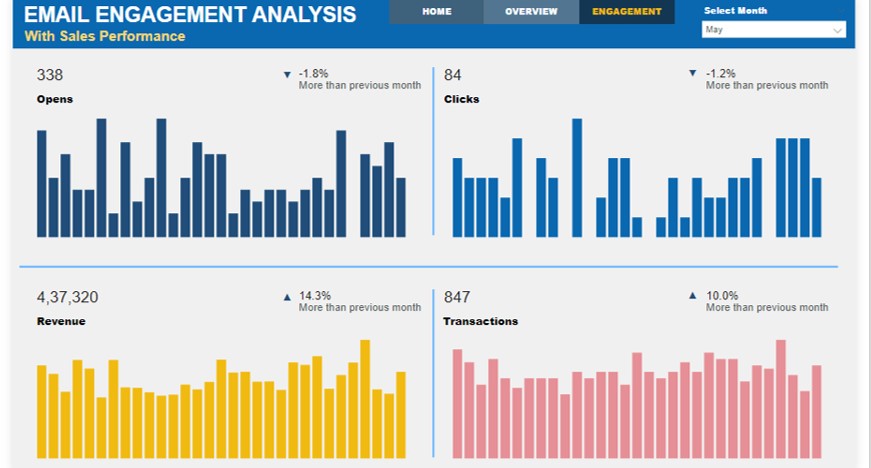
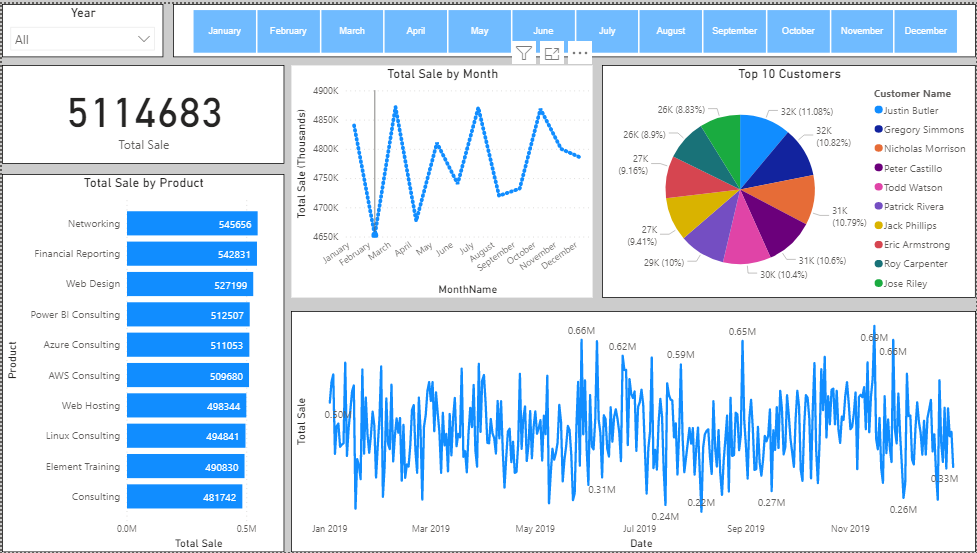
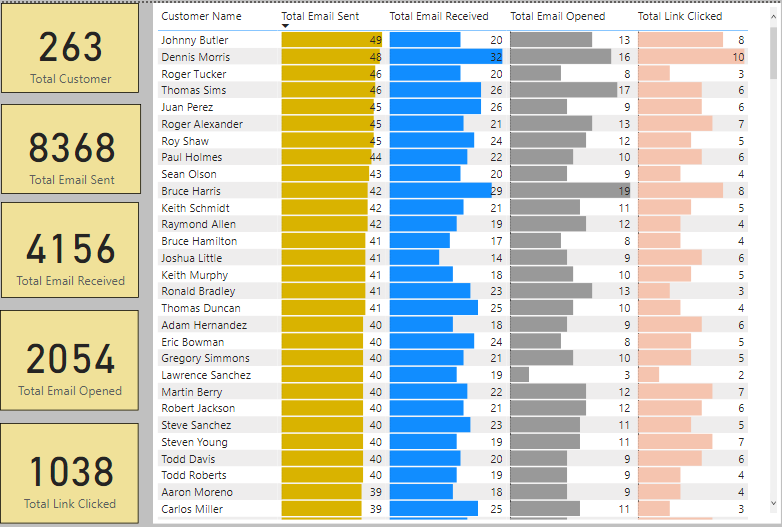
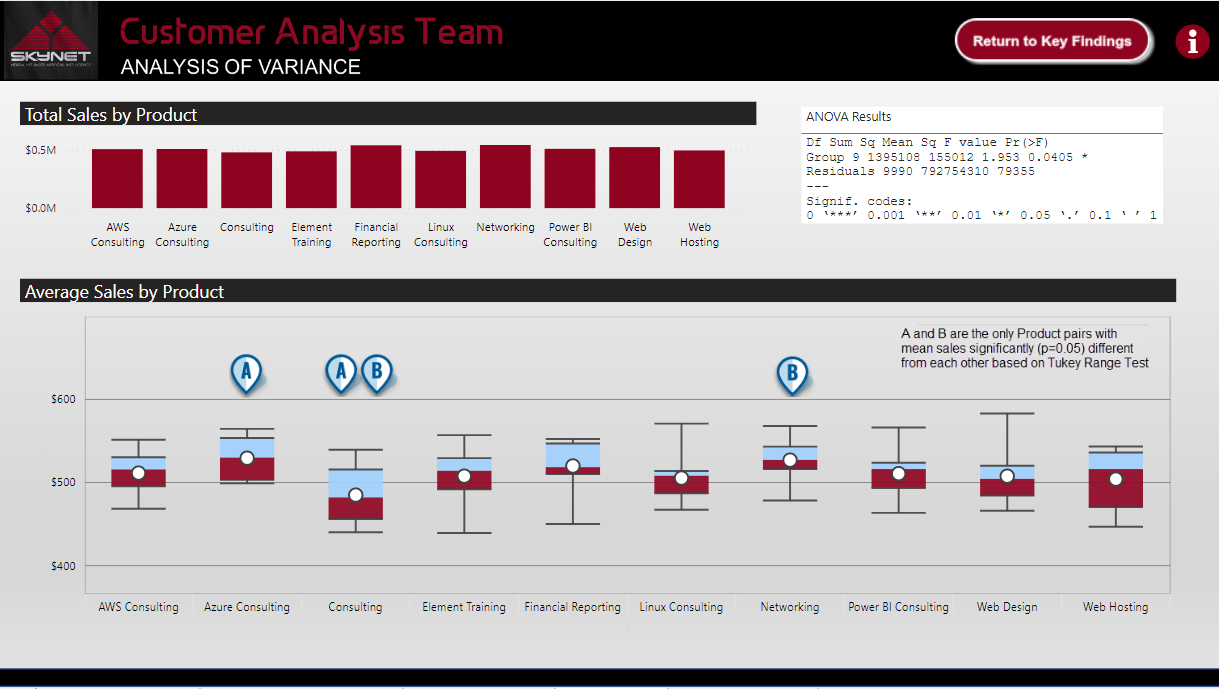
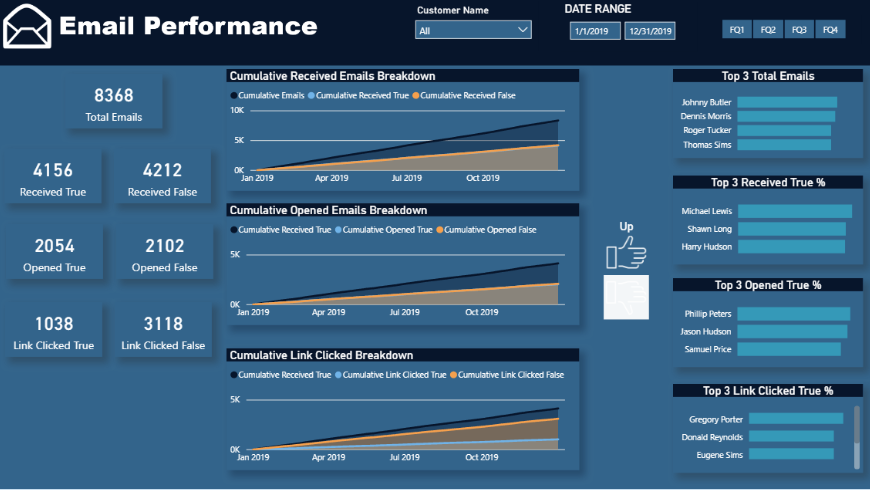
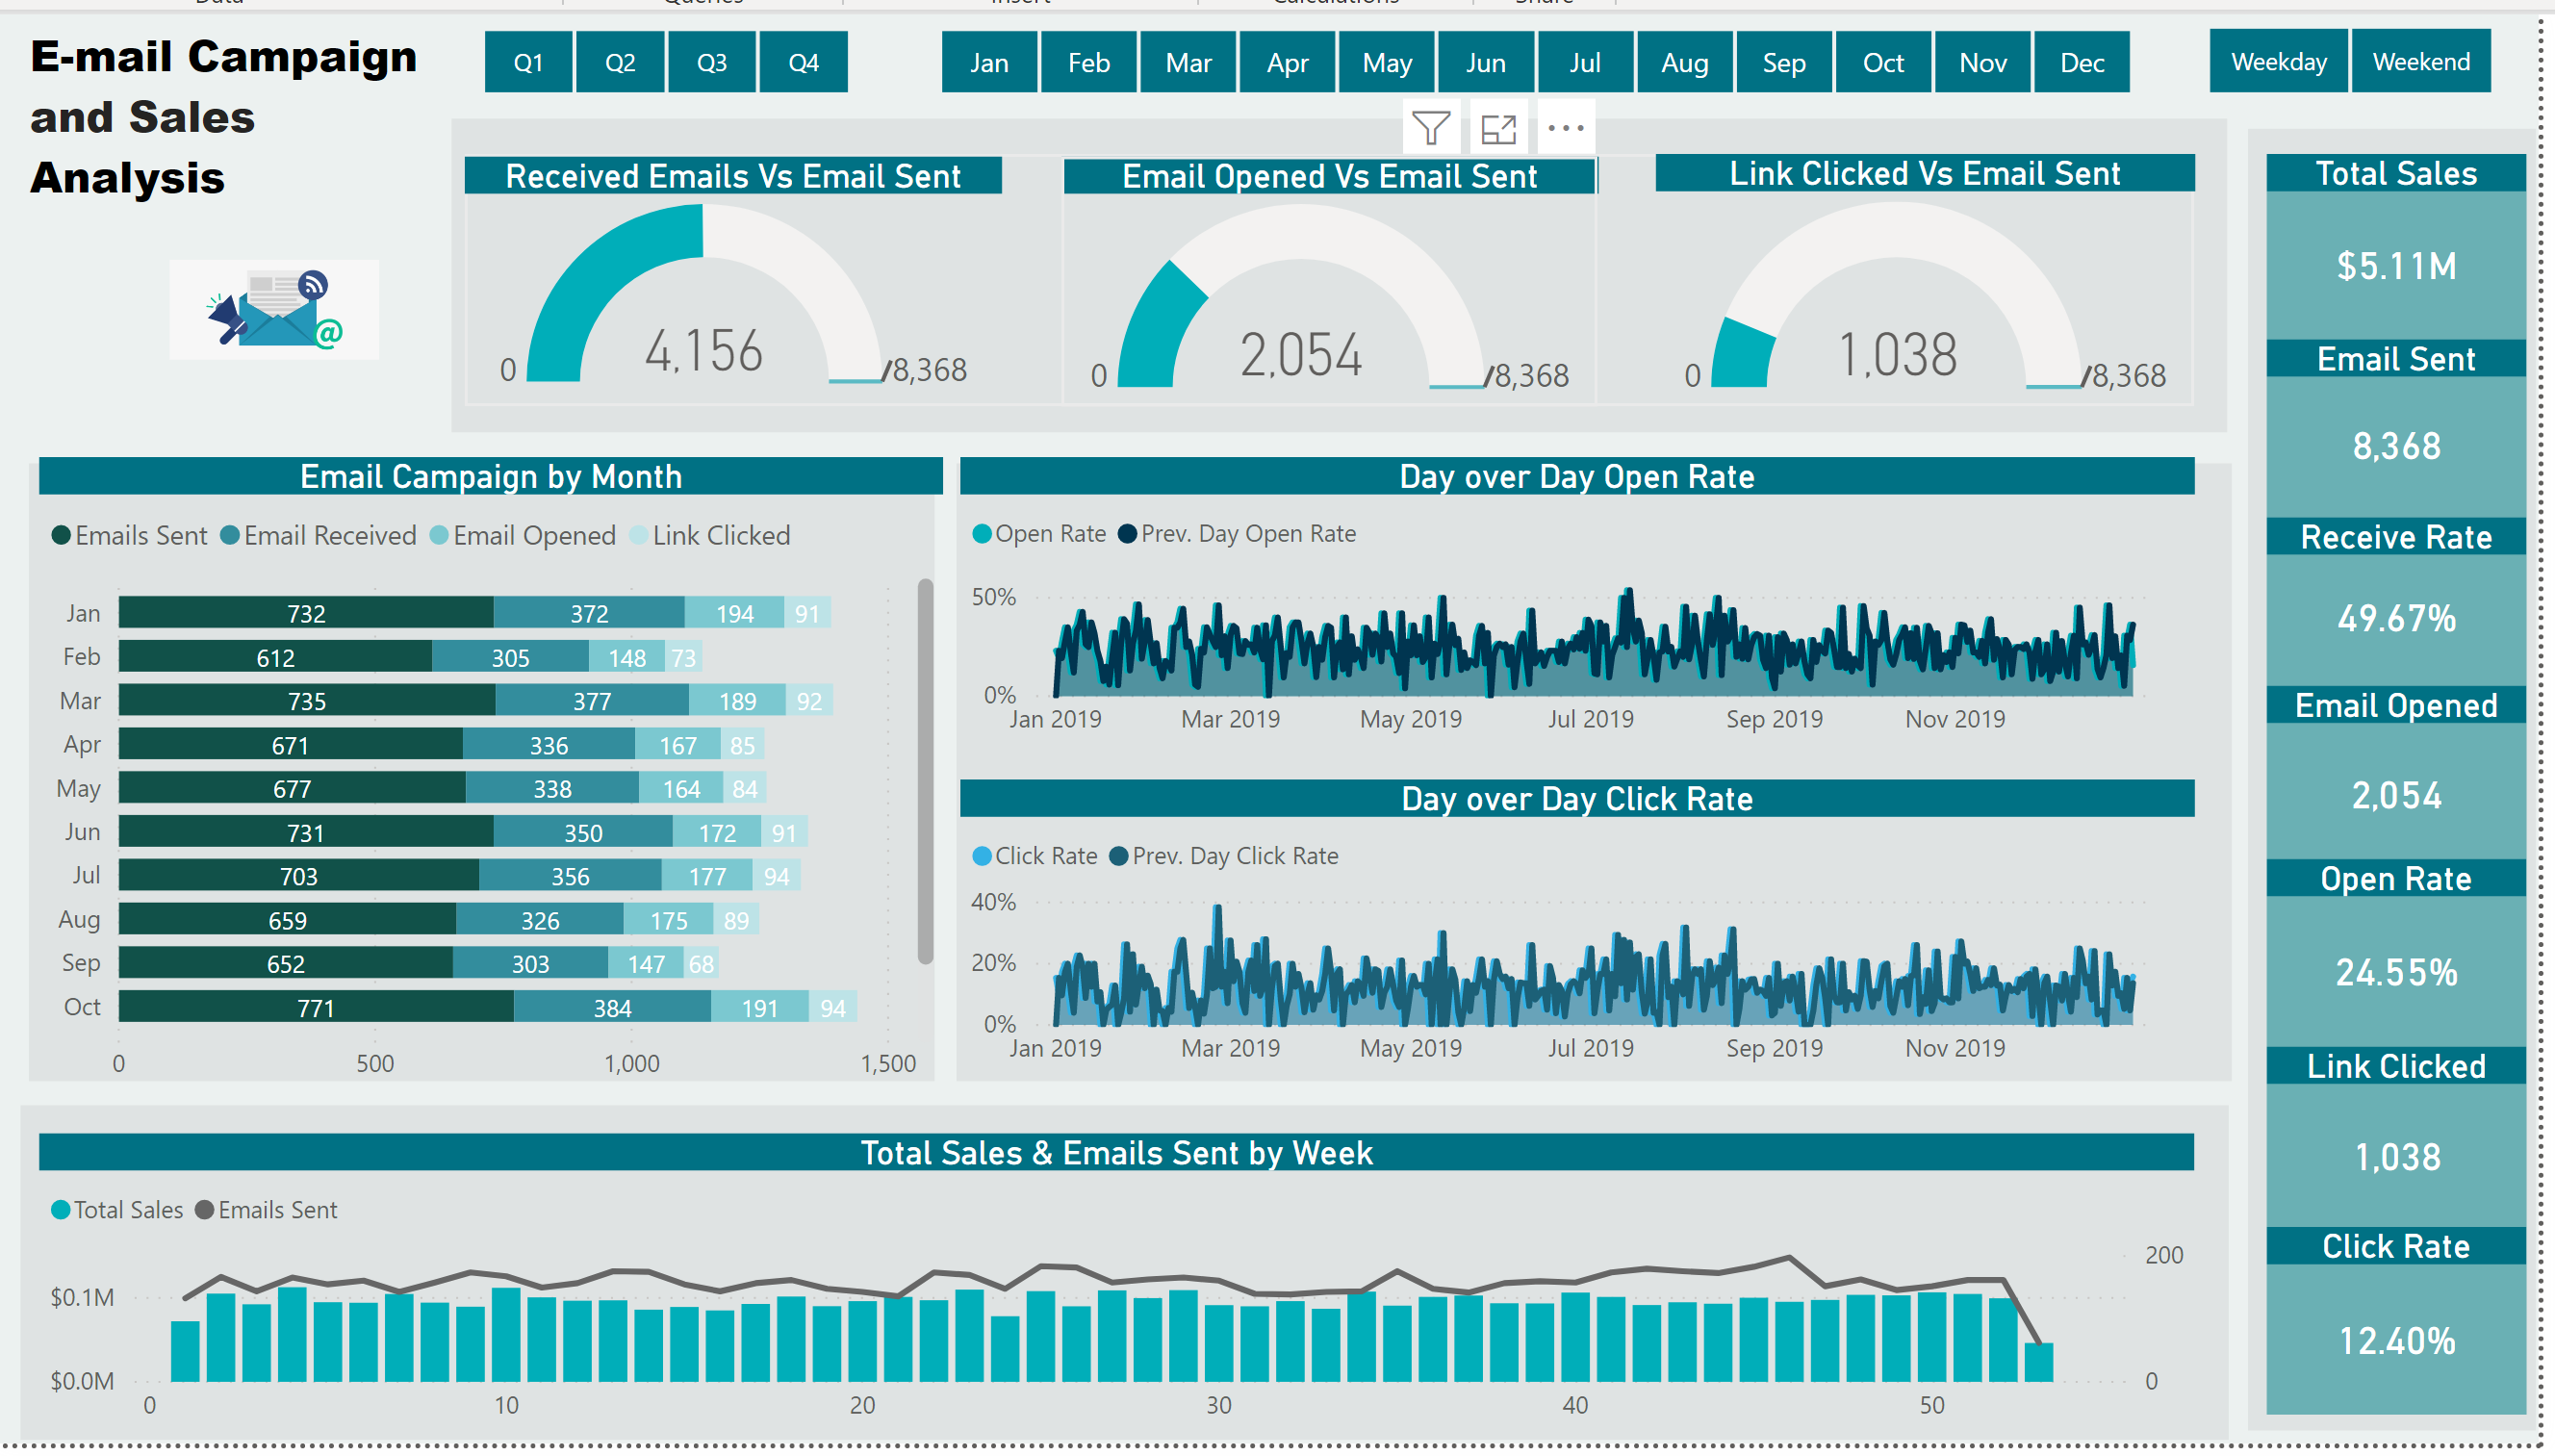
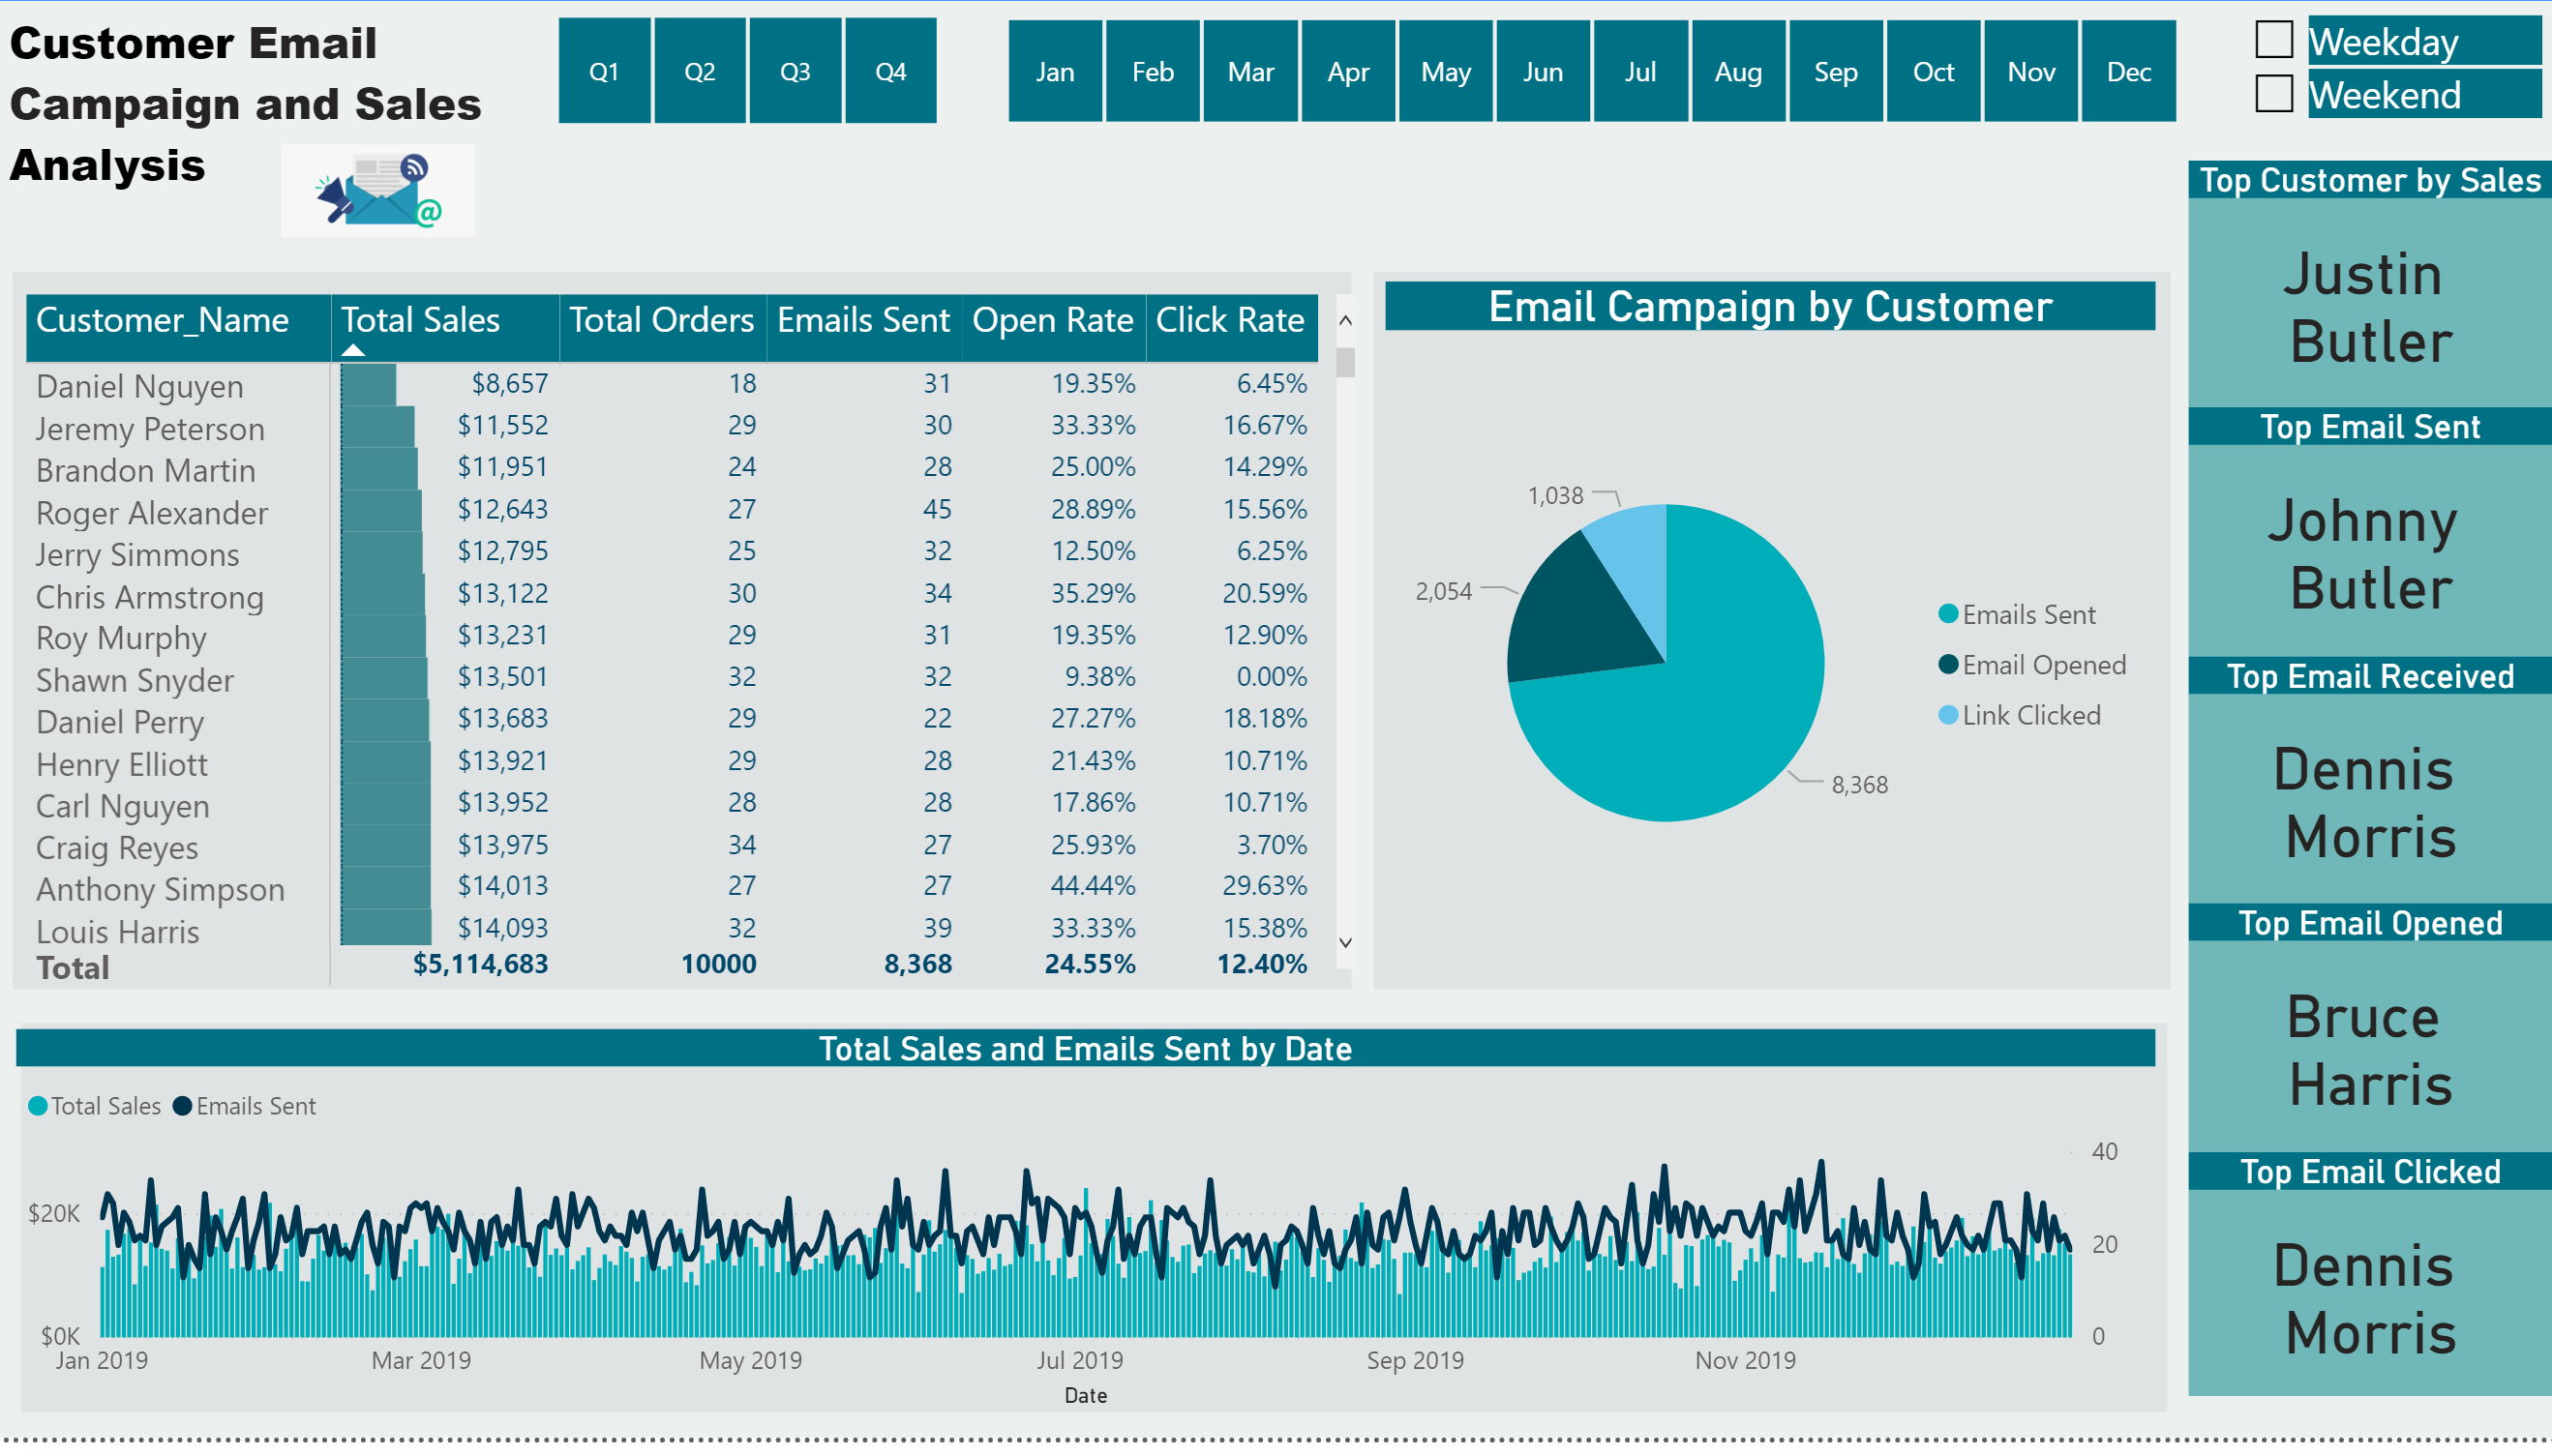
The customer engagement manager (Janet) has just returned from a meeting and has been given two data sets. One contains customer sales information and the other customer engagement information.

Janet is now looking for you to produce a report that looks at both data sets and gives us some insight into customer behaviour.

She is not sure if there is a correlation between sales and engagement but would like to know either way.

There is 1 years worth of data taken from both systems.

The ball is now in your court and you need to find a way presenting this data back to Janet and the team.

SUBMISSION DUE DATE - Sunday, 28th June 2020 (PST)

Please can you all submit your PBIX files to powerbichallenge@enterprisedna.co

Objective: Produce a report which summarises both data sets.

The data set can be downloaded below both datasets are in the one Excel file.

Best of luck!

Any issues or questions please reach out.

Haroon

Enterprise DNA

4 Likes

@haroonali1000,

Terrific scenario, but I think there’s a problem with the email leads data. I was doing some preliminary data analysis and ran the following three crosstabs. In each case, I don’t think a nonzero number in the circled cells makes logical sense (i.e., emails not received but opened, not received but links clicked, and emails not opened but links clicked):

How should we handle this in our analyses?

Thanks.

  • Brian
6 Likes

Hi @BrianJ great shout! Something I overlooked while anonymising the data.

I have updated the link above.

Apologies all who have already downloaded but please get the latest data.

Any issues get in touch.

Haroon

@haroonali1000,

:+1:. Re-ran the crosstabs with the new data and all the internal logic now looks good.

On the face of it, the data look pretty simple, but there’s a lot of depth and complexity to this one. Really eager to see all the different ways people attack this problem.

Thanks!

  • Brian
2 Likes

Thanks Brian.

Totally agree should be interesting to see the variety.

Regards,
Haroon

Thanks to @BrianJ for raising the data issue. Despite I found the similar issues, I have come far with existing data considering it a part of challenge :slight_smile:
But updated data will make the work more interesting surely and hence requesting @haroonali1000 to consider extending few days on it.

Regards

@Brianj, thank you for this quick catch!

I’m in on this one. Looking forward to submitting my work!

5 Likes

Sure, don’t worry the dates are indicative so there is room for adjustment. Just submit when you can.

Thanks
H

1 Like

Hello Friends,

I am attaching the images and link to my Customer Insight dashboard for this challenge. Any feedback and suggestions are welcome.
Eagerly waiting to see others Reports.

Thank you,
Mohammed Ali.

Link: https://community.powerbi.com/t5/Data-Stories-Gallery/Email-Marketing-Dashboard-Customer-Insight/m-p/1182085#M4145

8 Likes

Wow Great effort. Definitely looks the part.

Could you also email your submission to powerbichallenge@enterprisedna.co

Regards,
H

1 Like

Hi,

Attaching images, I am still learning :slight_smile:
Your feedback and suggestions are most welcome, Please.

6 Likes

@haroonali1000 and @EnterpriseDNA,

Great job on the scenario - I really had fun digging in to this one.

Screenshots of my entry below. Feedback welcomed.

  • Brian

Here’s the link to the published report.

EDNA Challenge 2 - Customer Analysis v2 – Brian Julius.pbix (1.9 MB)

12 Likes

Wow liking the look of these @BrianJ @sachince61.

Awesome work.

ALL can you please ensure you send a copy of your PBIX file to: powerbichallenge@enterprisedna.co

Regards,
H

@haroonali1000 & @EnterpriseDNA,

Here is my submission for Challenge #2.


Here is weblink:

Thanks
Jarrett

10 Likes

@JarrettM,

:+1:. Really like the way you structured the What-if analysis. I’m filing that away for future use…

  • Brian
2 Likes

Hello everyone,
Here is my Power BI Report for this challenge. I am still learning Power BI and your feedback and comments will be much appreciated.
Thanks.


This is a link to my published report.

12 Likes

Hi @BrianJ, this is a really cool representation and a insightful dashboard. So much to learn, is there any chance of sharing your Pbix file.

Thanks in advance :smile:

@Mohammed_ali,

Thanks very much for the positive feedback. I’m happy to share my file - I’ve posted a copy of the PBIX below the screenshots in my initial post. I hope you find it helpful – please just give a shout if you have questions.

  • Brian
1 Like

Got it… Thanks @BrianJ