Here’s Rachwen’s entry for Power BI Challenge 18. @Rachwen_Mesbehi, feel free to add other details of your work.


Here’s how Rachwen described it:
My last challenge was challenge 10 ,YES ! I missed seven challenges, hope this new report cover my missed ones.
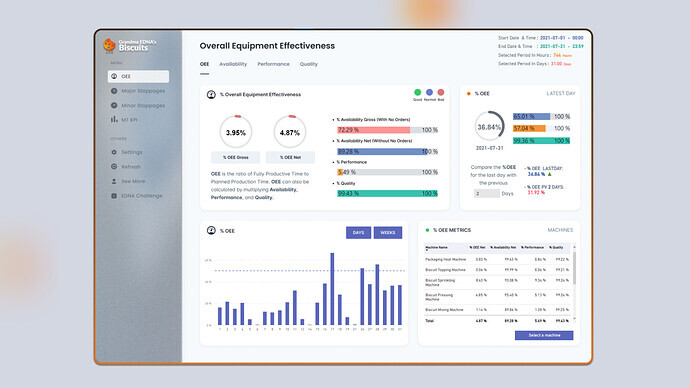
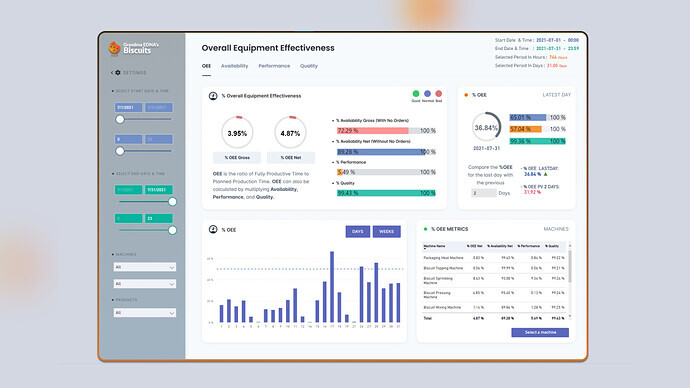
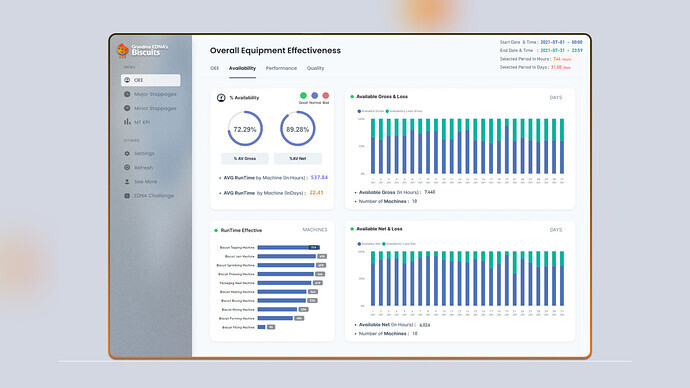
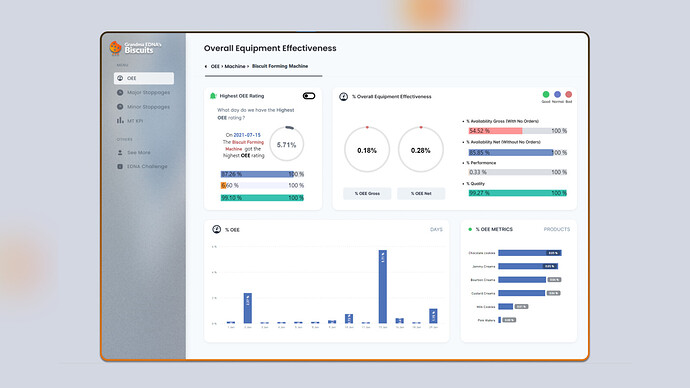
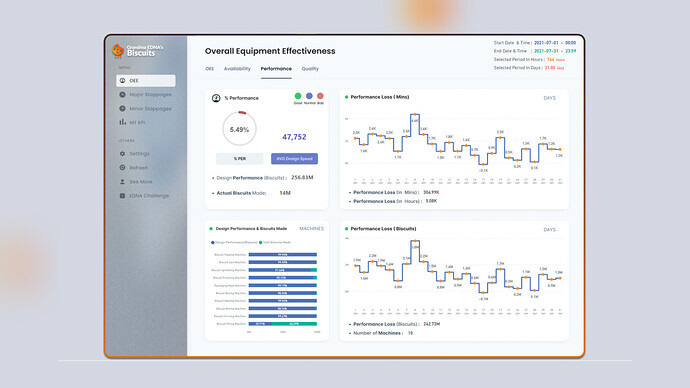
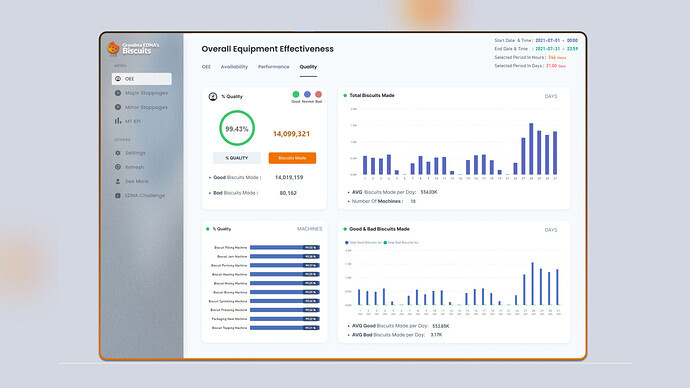
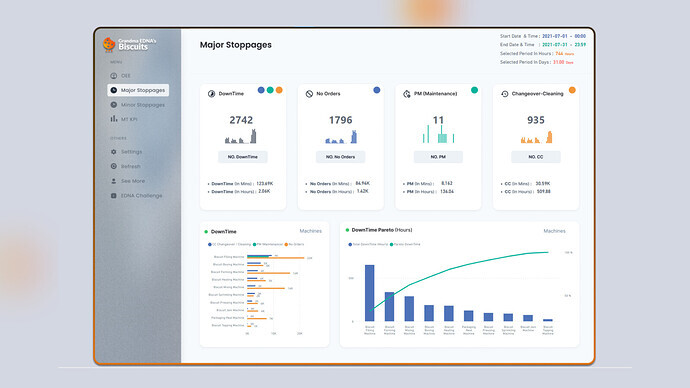
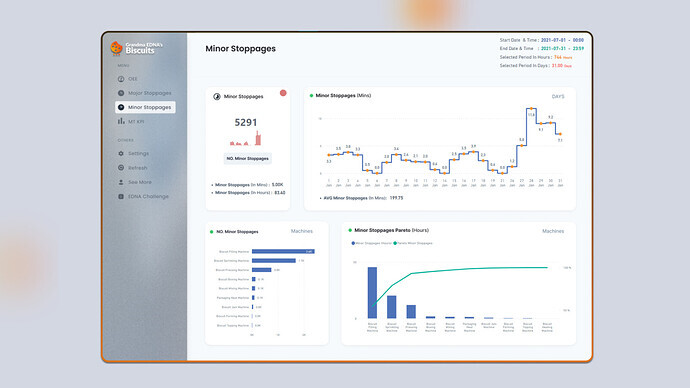
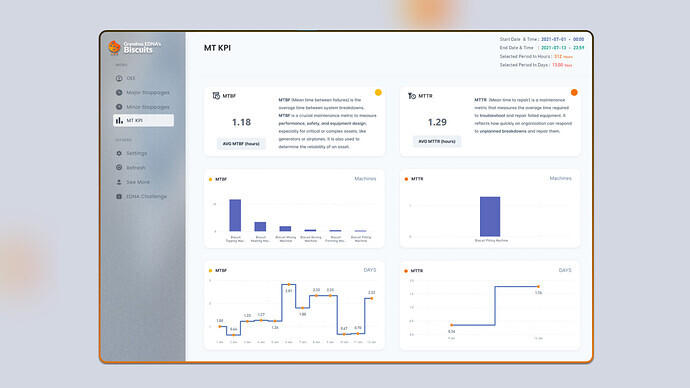
So here is my submission for Challenge 18 - OEE Manufacturing Report.
- Some Dax Measures from the report :
- GoodBiscuitsMade Inc.(Calculate the incremental values for good quality biscuits)
GoodBiscuitsMade(Inc.) =
VAR Machines = ‘Fact’[MachineID]
VAR Products = ‘Fact’[ProductID]
VAR Datees = ‘Fact’[StartDate]
VAR Timee = ‘Fact’[StartTime]
VAR PrevRow =
CALCULATE (
MAX ( ‘Fact’[GoodMadeBiscuits] ),
FILTER (
‘Fact’,
‘Fact’[MachineID] = Machines
&& ‘Fact’[StartDate] = Datees
&& ‘Fact’[ProductID] = Products
&& ‘Fact’[StartTime] < Timee
)
)
RETURN
IF (
PrevRow = BLANK ()
|| NOT ( machines = 1 )
|| ‘Fact’[GoodMadeBiscuits] = BLANK ()
|| PrevRow > ‘Fact’[GoodMadeBiscuits],
RANDBETWEEN ( 800, 1800 ),
‘Fact’[GoodMadeBiscuits] - PrevRow
)
- Available Gross_in Mins(calculated the peroid selected for all the machines by date and time ) =
VAR MinDateSelected =
VALUE (
COMBINEVALUES (
" ",
MIN ( Dates[Date] ),
TIME ( MIN ( ‘Start Time Table’[Hour] ), 00, 00 )
)
)
VAR MaxDateSelected =
VALUE (
COMBINEVALUES (
" ",
MAX ( Dates[Date] ),
TIME ( MAX ( ‘End Time Table’[Hour] ), 59, 59)
)
)
VAR Result =
DIVIDE( DATEDIFF ( MinDateSelected, MaxDateSelected, SECOND ),60,0)
RETURN
Result*‘Availability Measures’[Machines Number]- CC Changeover / Cleaning (calculated the downtime for “CC” category filtred by date and time ) =
VAR MaxDate =
MAX ( Dates[Date] )
VAR MinDate =
MIN ( Dates[Date] )
VAR StartTime =
TIME ( MIN ( ‘Start Time Table’[Hour] ), 00, 00 )
VAR EndTime =
TIME ( MAX ( ‘End Time Table’[Hour] ), 59, 59 )
VAR StartDT = MinDate + StartTime
VAR EndDT =
COMBINEVALUES ( " ", MaxDate, EndTime )
VAR Result =
CALCULATE (
SUM ( ‘Fact’[Duration] ),
FILTER ( ‘Fact’, ‘Fact’[Duration] > 3 ),
FILTER (
‘OEE Categories’,
‘OEE Categories’[OEE Category] = “CC (Changeover Cleaning)”
),
FILTER (
‘Fact’,
OR (
AND ( ‘Fact’[StartDate] = MinDate, ‘Fact’[StartTime] >= StartTime ),
‘Fact’[StartDate] > MinDate
)
),
FILTER (
‘Fact’,
OR (
AND ( ‘Fact’[EndDate] = MaxDate, ‘Fact’[EndTime] <= EndTime ),
‘Fact’[EndDate] < MaxDate
)
)
)
RETURN
Result
- UI/UX Concept : I used Figma to create and design the entire UI/UX concept
Here’s the link to the report:
To learn about the real-life scenario presented for the challenge, be sure to click on the image below.