Power BI Builds 18 - OEE Manufacturing Report

Hello All,

I trust that you are keeping well!

I think it’s just about ok to wish everyone a happy new year!

It’s been go, go, go across several fronts at the Enterprise DNA headquarters as we gear up for another amazing year of content, training courses and so much more!

We have some seriously amazing stuff in the pipeline and things are moving so fast so please be sure to get adding us across your social media platforms and staying in sync with the Enterprise DNA community!

So here I am back for another instalment of the Enterprise DNA challenge!

Unfortunately I was out of action for the challenge 17 however I was involved in the background and just WOW the talent and creativity on display never ceases to amaze me.

Great work and the client was absolutely over the moon with the outputs. There entries led to some great internal discussions and views they hadn’t even considered.

A massive well done to all participants as genuinely there was something in every report to learn from. I think one of the best things about the challenge is it’s just firepit for ideas and views that you likely wouldn’t consider.

Admin

I just want to take a moment to cover of some admin around the challenge as we really want to see more of you getting involved.

To learn more about the challenge please see the link below:

I feel it is necessary for me to mention the benefits of participating and the impact it can have on your development. We at Enterprise DNA truly believe that getting hands on and practicing with real scenarios is the fastest way to mastery.

So I again encourage you all to try and get involved with the challenge in some capacity.

Be sure to check out the previous challenge entries here.

While the learning and experience of participating in the challenge is very rewarding itself we also have some great loot on offer for category winners. Please see below the categories.

Overall Winner – all entrants are eligible

First Time Participant winner - open to any Enterprise DNA member who is taking part in the challenge for the first time.

Winning Non-member - open to entrants not currently eDNA members.

There are some excellent prizes on offer from free membership (for all category winners) and more, to having your work showcased across the Enterprise platform. So please do get involved and share this opportunity with others who might be interested.

2 Likes

The Brief

You are an analyst working at ‘Grandma EDNA’s Biscuits’ one of the biggest manufacturers of biscuits in New Zealand. The company has made some serious investment into the machines and have had a number of sensors and advanced IoT devices fitted so that they can track and understand their operational efficiency.

The machines all have an expected capacity based on the product type.

IT have now managed to extract and consolidate the data.

Factory site management have tasked you with helping them understand what the data is showing.

OEE is one of the most significant measures for manufacturing productivity. (ITS MASSIVE, EVERYONE USES IT)

The gold standard in the manufacturing industry, OEE is made up of three key factors pertaining to production.

Availability - were our machines available when they were supposed to be?

Performance - were the machines producing the number of biscuits we were expecting?

Quality - Were all the biscuits produced, good biscuits?

OEE is the multiplication of these three factors.

To find out more about OEE please see the links below.

Further Requirements

Here are some more requirements around the data that you need to consider.

The data is made up of all the stoppages that occur on the machine in question.

A minor stoppage is classed as anything with a duration under 3 minutes.

A major stoppage is classed as anything over 3 minutes.

For each stoppage the cumulative number of biscuits produced is also recorded along with the good biscuits allowing us to deduce waste.

The business has summarised the key formulas required below.

Measure Unit Formula
Available Gross Hours 24*7
No Order Hours Recorded
Available Net Hours Available Hours Gross – No Order Hours
PM Preventative Maintenance Hours Recorded
CC Changeover / Cleaning Hours Recorded
Effective Runtime Hours Available Hours Net-PM-CC
Design Speed per SKU Consumer Units/Hour Contractual Speed
Design Performance Consumer Units Effective Runtime*Design Speed (for each SKU)
Runtime @ Design Speed Consumer Units Total Biscuits
Runtime @ Design Speed Hours Total Biscuits/Design Speed
Availability Gross % Effective Runtime/Available Hours Gross*100
Availability Net % Effective Runtime/Available Hours Net*100
Performance % Filled Consumer Units/Design Performance*100
Quality % Good Production/Filled Consumer Units *100
OEE Gross % Availability Gross%*Performance%*Quality%
OEE Net % Availability Net%*Performance%*Quality%
Weighted Design Speed Consumer Units/Hour Design Performance/Effective Runtime
Target Time Total Biscuits Hours Total Biscuits/Design Speed
Target Time Good Biscuits Hours Good Pots/Design Speed
Availability Loss Gross Hours No+PM+CC
Availability Loss Net Hors PM+CC
Availability Loss Gross % Availability Loss Gross Hours/Available Gross
Availability Loss Net % Availability Loss Net Hours/Available Net
Performance Loss Hours Effective Runtime-Effective Runtime*Performance%
Performance Loss Consumer Units Design Performance–Total Biscuits

it is your job as an analyst to summarise these findings and present back a report that provides the ability to track OEE across machines.

Entries are not limited by number of pages or technique. Feel free to use all the techniques at your disposal – tooltips, drill throughs, page navigation, etc.

That’s all for the brief!

Submission of entries

To be considered within the competition, entries are due no later than 11:59pm PST Sunday, February 6, 2022.

If you are not already following Enterprise DNA on LinkedIn please do so.

How to submit:

Email the completed PBIX file to powerbichallenge@enterprisedna.co

Take an image and the Publish to Web URL of your report and post it to the Enterprise DNA forum.

Take the image and URL and post it on LinkedIn tagging Enterprise DNA saying “I accepted the Enterprise DNA challenge.”

We always encourage all participants to do a writeup and share their experience of participating in the challenge and sharing it on the forum and on social media.

I f you need any help with publishing, please reach out to one of the team for assistance (post in the forum or email to brian.julius@enterprisedna.co).

Conclusion

A great opportunity to learn an invaluable skill of being able to produce and calculate OEE within power BI.

The techniques covered here are massively reusable across the board.

Get involved!

Any issues or questions please reach out.

Haroon

Enterprise DNA
Challenge 18.xlsx (463.1 KB)

6 Likes

file name Challenge 17?

1 Like

My bad Keith same data have renamed file above.

Thanks,
H

2 Likes

@haroonali1000 - did you mean for the due date to be February 12th?

1 Like

thanks for the change but you have date of Dec 12 too :slight_smile:

1 Like

Maybe we’re getting 11 months to complete this one, in that timescale I might finish my 2nd ever entry :joy:

5 Likes

I like it @DavieJoe …maybe i can meet that deadline too in 11 months hehehehheheh

4 Likes

Sorry guys, got too much cool stuff planned for 2022 to give you 11 months on this one…

Correct deadline is 11:59pm PST Sunday, Feb 6, 2022. I’ve corrected it above as well.

Despite now only having 3.5 weeks to complete, I hope you all dive in on this one.

  • Brian
4 Likes

Hi,

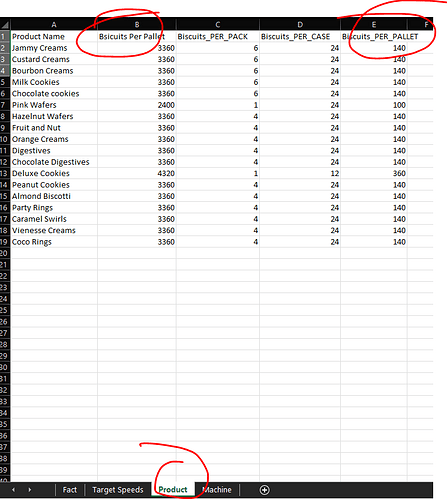
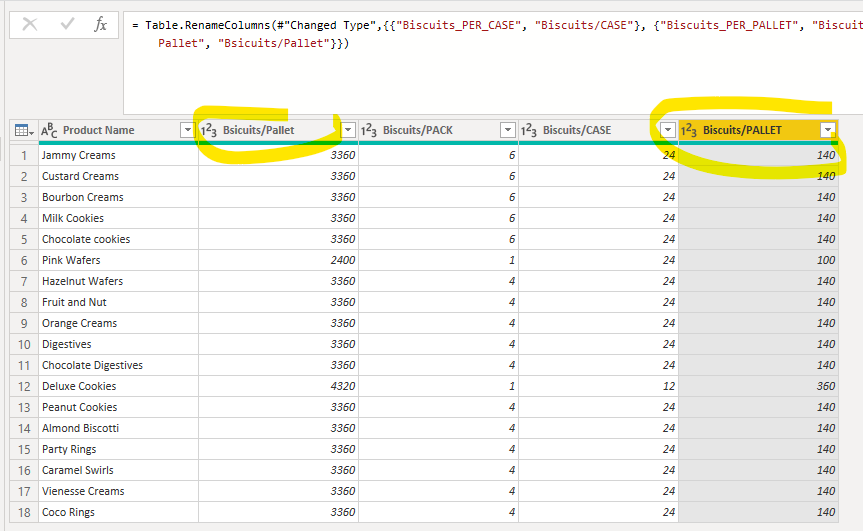
Just scanning the Challenge 18 data file and looking at the Product tab I can see two similar columns Biscuits Per Pallet. Which is which?

Thanks

Patrick N

2 Likes

Ha! Seems fair :wink:

@ambepat - it looks that the first column is total number of biscuits in a pallet and the last column should be “Biscuit Cases” Per Pallet. 24 X 140 = 3,360. But its a good callout.

3 Likes

@tweinzapfel ,

Thanks – that looks right to me, but I’ve messaged @haroonali1000 to confirm.

  • Brian
2 Likes


Product Sheet Tab. What would they mean? Biscuits per Box?

1 Like

I’m pretty sure it is cases per pallet. Divide 3360 by 24 and you get 140.

Thanks
Jarrett

2 Likes

And just to add some further clarification for the USA folks - the reference to biscuits would be what we would refer to as cookies. Took me a little time to figure this out (with the help of the company name being from New Zealand). And for anyone in the Southeast region of the US, if you were like me, you immediately thought of (and craved) Bojangles.

2 Likes

Hi Haroon

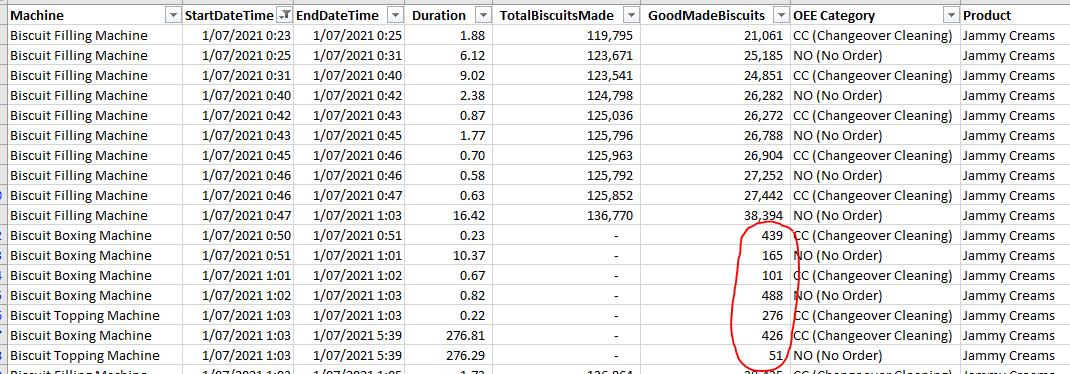
What does “NO (No Order)” mean?

Are you able to help explain what those numbers represent ( 439, 165 then 101…) Pardon me, i’m confused, you said cumulative

Thank you

2 Likes

Tim,

Mmmm…Bojangles. That immediately conjures good late-night college memories…

  • Brian
2 Likes

@haroonali1000 ,

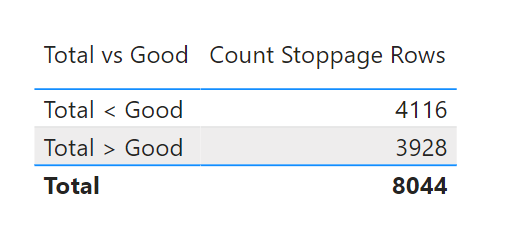
I’m having a great time digging into this challenge, but I think I’m having a problem interpreting the stoppage data. How can Good Biscuits be greater than Total Biscuits, as in the excerpt below:

When I ran the following simple analysis for the entire dataset, it showed that for over half the stoppages Good > Total

image

What am I missing here?

Thanks!

– Brian

4 Likes

@haroonali1000 ,

A nice challenge !

Questions are already raised by Brian and WanTeck, but some further questions about the data:

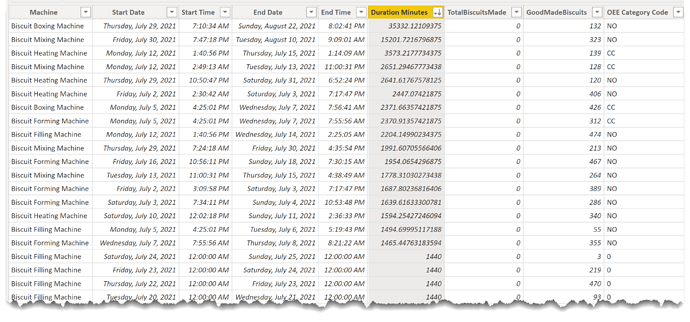
  1. why is the runtime almost ZERO (240 minutes, 0,1%) ?
  2. why is the ratio good biscuits / total biscuits so low, only 1/3 ? (458 / 1.313)

Kind regards, Jan

2 Likes