Here’s Paul’s entry for Power BI Challenge 18. @Paul.Gerber, feel free to add other details of your work.

Here’s how Paul described it:
I approached this data challenge like I do with any other data project; dig into the raw data and make sense of it. I admit I know nothing of OEE but now I do. I found myself doing a lot of reading on OEE and the KPI measures that are needed to let the manufacturing unit know how to improve production with the machines and to see what issues arise.
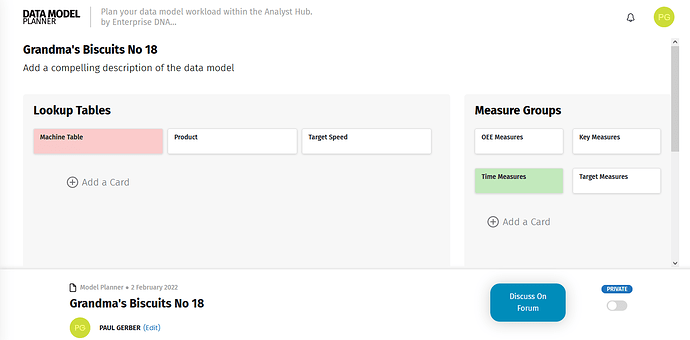
So after looking into the data, I thought of a learning video where Sam McKay brought up the Data Model Planner. It helps to get organized in the beginning with not only your layout but your thoughts on how to tackle any data.
This challenge is unlike my last one as far as thought process. I started thinking of color schemes and layouts. I chose simple blues and a cleaner background; not loud and overwhelming.
But as I went through the data and starting building simple DAX measures then branching out, I noticed some numbers just weren’t making sense. I did my best to showcase the best visuals that would provide decent insights in the making of biscuits (cookies if you’re a Yankee, wink wink).
I started to realize that Availability and Efficiency are key components to OEE. Below are some definitions.
Availability
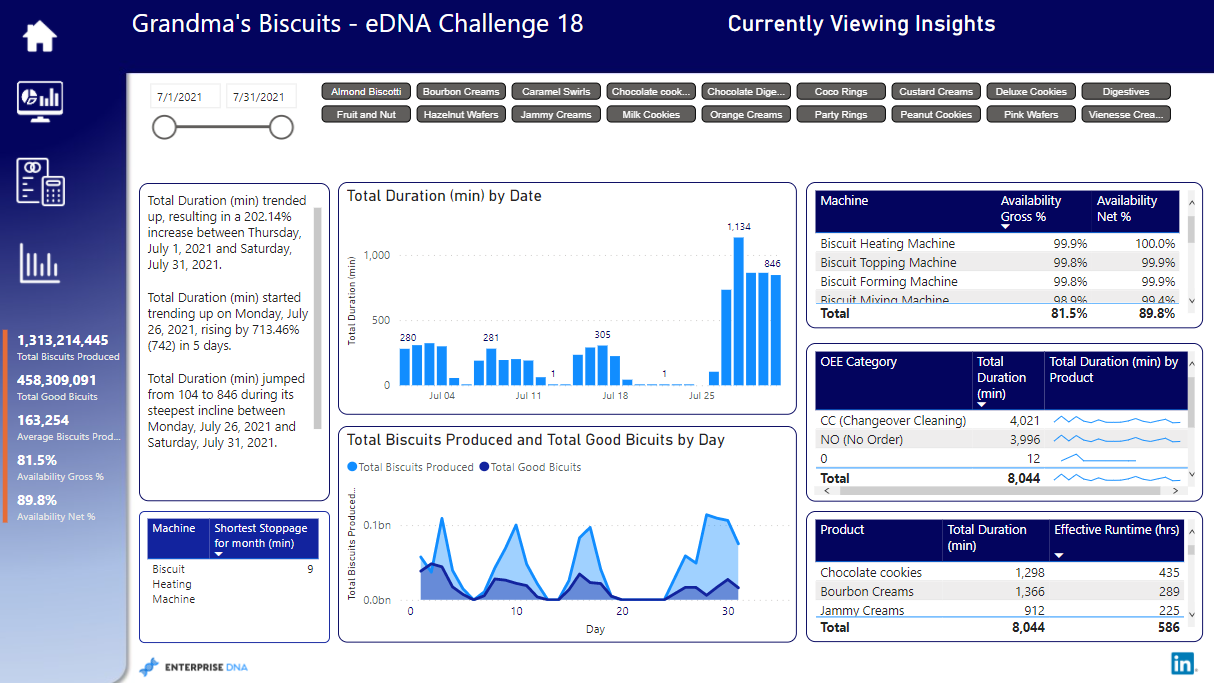
The goal should be at least 90%. Grandma’s Biscuits had an overall net % of 89.8 and a gross of 81.5%
Gross Availability should indicate when there is excess capacity in the equipment, in case it is needed.
Net Availability use the scheduled (excluding external causes) run time divided by the actual run time, realizing that the equipment has unused capacity. This allows personnel to concentrate on maximizing the equipment performance during the scheduled time, always realizing that there is additional capacity if it is ever needed.
Efficiency
The goal here should be at least 95%.
So back to the topic of some values just didn’t make sense. Some of the biscuits had an OEE Gross % of 0.0. Because it’s availability was 95.4%. Meaning they did not make those biscuits often. A great example of maybe digging into as of why values are low would be Jammy Creams. This particular cookie had a performance of 76.2% and had 912 minutes consisting of Changeover Cleaning or No Order status. OEE was 26%.
When looking at the Details page hover over the table and a tooltip will appear showing some KPIs.
In this challenge, I used again branching out DAX measures, separate measure folders to indicate if they were related to KPI, OEE, Time or Target.
I used Dynamic Measures for titles, TREATAS with Summarize measures for bringing in values from other tables that didn’t have a relationship, RANKX with ISINSCOPE ( this was new to me), I always started adding comments inside the DAX code to help not only me but others the logic.
Rank Product OEE Gross = – ISINSCOPE is useful to detect if a column is currently
– in the rows or columns of a visual (like groupby columns
– of SUMMARIZECOLUMNS) AND it has only one value visible
IF (
ISINSCOPE( ‘Fact’[Product]),
RANKX (
CALCULATETABLE (
VALUES ( ‘Fact’[Product] ),
ALLSELECTED ( ‘Fact’[Product] )
),
[OEE Gross %]
)
)Total Count of Biscuits/Pallet = //Filled Consumer Units
CALCULATE([Total Good Bicuits],
TREATAS(SUMMARIZE(‘Fact’, ‘Fact’[Product]),
‘Product’[Total # Biscuits/Pallet]
)
)Used this DAX specifically to single out the OEE category:
Total NO (min) = CALCULATE([Total Duration (min)],‘Fact’[OEE Category] IN { “NO (No Order)”})
Lastly, the value of zero in the OEE Category is probably an error on the machine end or the value entered when it is not know or not entered correctly.
Anyway, this is my brief summary of this challenge. I look forward to the next. Brian knows that I had accidently cut instead of copy my PBIX files to another drive location and overwrote the files. So I had to start over this week, then a power outage occurred during this week also; so I had to scramble to get this done FAST!! I hope I didn’t miss anything.
Paul
Here’s the link to the report:
To learn about the real-life scenario presented for the challenge, be sure to click on the image below.