Here’s the entry from one of our non-member participants, Sabine.
To learn about the real-life scenario presented for the challenge, be sure to click on the image below.

Here’s the entry from one of our non-member participants, Sabine.
To learn about the real-life scenario presented for the challenge, be sure to click on the image below.
This post is part of the Enterprise DNA platform improvements. Through these posts, members and non-members can showcase the resources and inspirations on how they come up with their challenge submissions. We hope all members can utilize it efficiently.
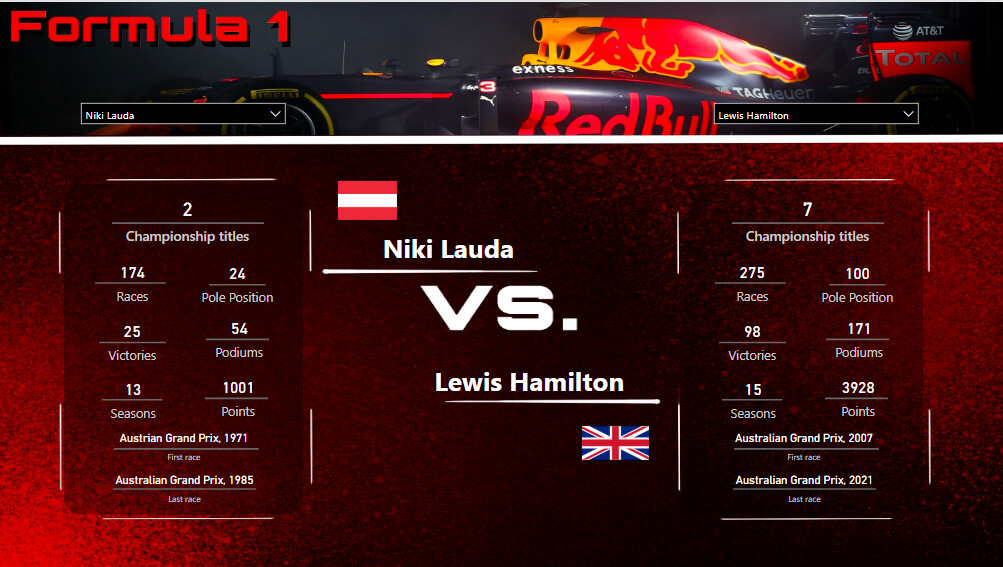
Beautiful design Sabine.
Simple and effective and that is all that’s required in most cases. Well in more cases than you think. I love how you thought outside the box a little bit around what you wanted to showcase as well. You decided to look at one dimension and then highlight the comparison between those. Instead of looking at all the data and thinking you needed to report on everything which is honestly not what is required in a lot of cases so I really appreciate your thought process for that.
I also think that your design is beautiful. The way you have created grids for your header area and also the data and analysis area in your report page. It all just works. I think the colors particularly the white a text and numeric values and the main section of your report just makes everything stand out that little bit more. Also love how you’ve integrated the flags and how they are dynamic based on a selection. Really smart a small addition that really adds up to making a more compelling report.
This is some top work. Congrats.
Sam