Here’s Hossein’s entry for Power BI Challenge 15. @sedhosen, feel free to add other details of your work.
List of Page Tooltips:
- Scatter plot tooltip
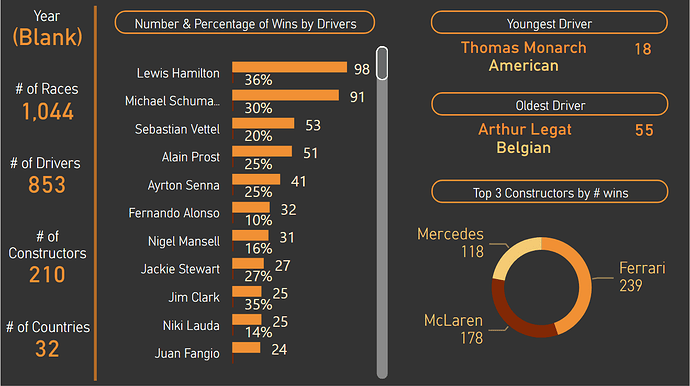
- Year Tooltip
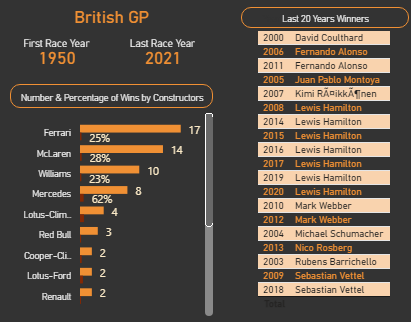
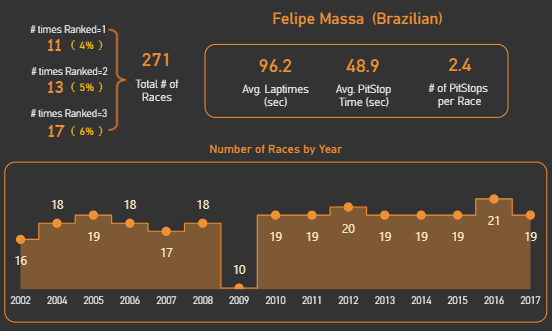
- Race Tooltip
- Driver Tooltip
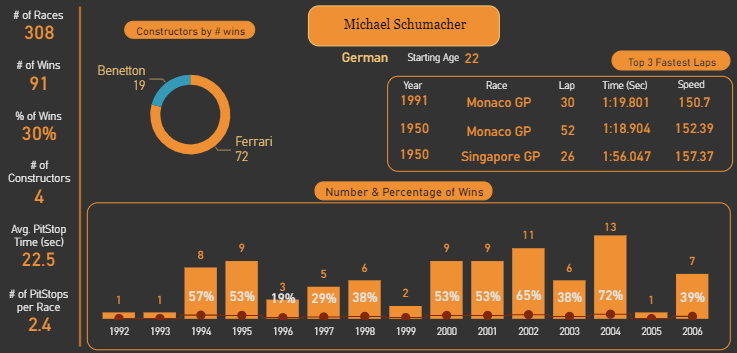
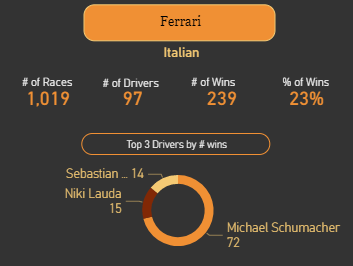
- Constructor Tooltip
Here’s how Hossein described it:
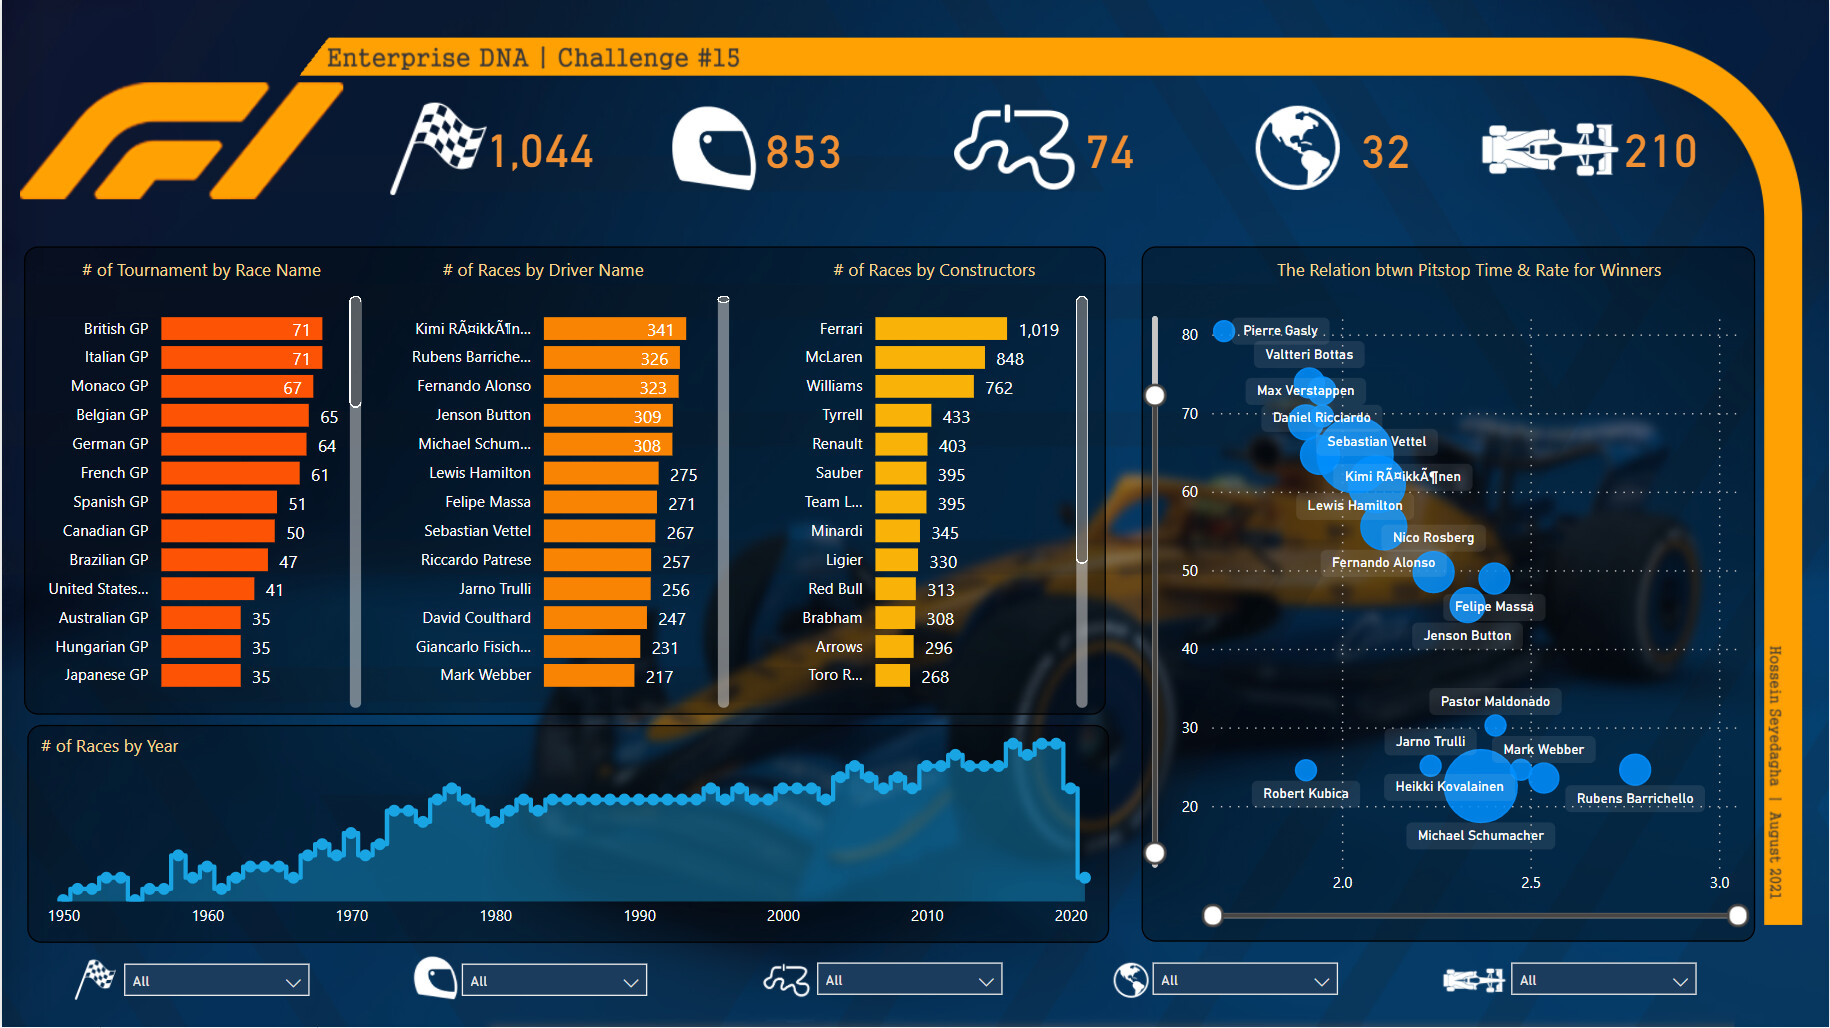
It was a novel idea to create a one-page report. So, this is the main page with quite a lot of page tooltips  I really wanted to stick to the one-page criteria, so didn’t use any sort of navigation at all.
Since I love scatter plots, I wanted to have at least one scatter chart in the report, so decided to use it for illustrating the relationship between Pitstop Time , Pitstop Rate , and The Number of Wins for each driver that at least have had one win in his races.
I used three simple bar charts for the Number of Races by Race Name , Driver Name , and Constructor Name and put all the related information on the tooltips.
I highly wanted not to split the dataset, or just use one last year’s data. So, I created the area chart showing variations in the number of races for different years, then put all the useful information about the drivers and constructors into the tooltip.
Used Adobe Photoshop to create a blurred background.
And to add some creativity placed slicers at the bottom of the page.
Hope you enjoyed it 
To learn about the real-life scenario presented for the challenge, be sure to click on the image below.

This post is part of the Enterprise DNA platform improvements. Through these posts, members and non-members can showcase the resources and inspirations on how they come up with their challenge submissions. We hope all members can utilize it efficiently.
Hey Hossein, brilliant report!
You know what I love the most here is your color scheme and design. I love how you’ve got this unique border with a bright yellow color. So bold and beautiful in my opinion. And then you have integrated different shades of bold oranges and blues which to me make your insights really stand out. Well done on being bold.
Also the icons and I think the way that you have incorporated tooltips in your report is superb. I can see you’ve really put a lot of effort into how your tooltips look. I think the way that we can customize tooltips is one of the most compelling features of power BI right now. And I think you’re really taking it to another level so congratulations.
I think you have really taken the brief here and put together a super submission that would be close to one of the best reports this time around. Really encourage you to keep going and keep testing yourself and continuing to improve as you look to challenge yourself on some of the next rounds.
Superb stuff
4 Likes
@sam.mckay
Thanks for your kind words. Your comments always mean a lot to me.
I’ve always learned from these amazing challenges. I believe that it does not matter what is your level in Power BI development, how you should start, or when is the right time for you to start. The only thing matters is just participation. Learning will be achieved only through the process of thinking to create a Power BI report not by just watching how others can create it. Only after you get your hands dirty, would you expect improvements.
Thank you again for creating such a great community.
Best,
Hossein
3 Likes