Here’s Eze’s entry for Power BI Challenge 15. @Eze, feel free to add other details of your work.
Here’s the link to the report:
And here’s how Eze described it:
Measures
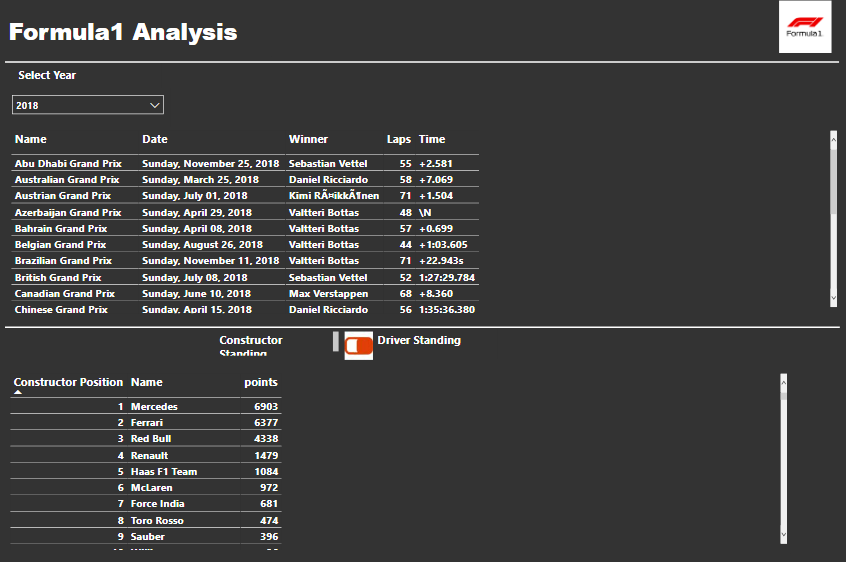
- Used the RANKX function to get the Positions on the Driver and Constructor Standings tooltip
- Had selected text using these measures (Selected Constuctor, Selected Driver and Selected Race) which was
displayed on a CARD visual in each of the respective tooltips- Calculated 3 Average measures (ie. Avg. LapTime Position,Avg Qualifying Position and Avg. Race Position)
and use them on the Driving Standings lookup pageLearning Outcomes
- Use a button toggle button feature to switch between the Constructor and Driver Standings pages and show this on the same page. Enhanced my knowledge in using bookmarks to achieve this.
Things to Learn/Improve on
- Ability to add more compelling insights on a single page
To learn about the real-life scenario presented for the challenge, be sure to click on the image below.
