Here’s David’s entry for Power BI Challenge 15. @davidcenna, feel free to add other details of your work.
Here’s the link to the report:
And here’s how David described it:
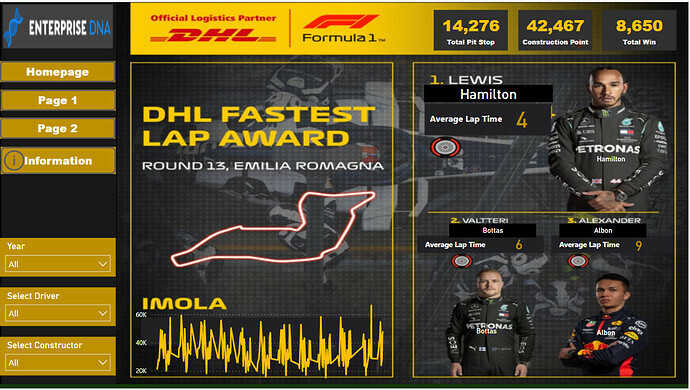
This submission was challenging because of my little or no experience with F1, so understanding most key metrics was the major challenge experienced. I have to be using google search to help define some terms.
To learn about the real-life scenario presented for the challenge, be sure to click on the image below.

This post is part of the Enterprise DNA platform improvements. Through these posts, members and non-members can showcase the resources and inspirations on how they come up with their challenge submissions. We hope all members can utilize it efficiently.
Wow David this is awesome. I absolutely love the imagery that you have created. I don’t even know how you found all these images or incorporated them in such a unique way in your report.
huge congratulations on this. I love how you’ve used imagery throughout, from the race tracks to the drivers to the cars. It’s awesome stuff and the insights are great as well.
Thanks for all the effort you’ve put in here, it’s super impressive. I might even steal some of these ideas for myself. You know the one thing that really stands out here is just how versatile power BI is. Just with a little bit of creativity how much variation you can get around how a power BI report actually looks. You’ve highlighted that to the max so super well done.
Sam