Hi All,
WOW! What a start to the challenge. Some seriously awesome work by everyone. Its been fascinating to see all the entries and the similarities between them yet how distinctive they are to each of the developers. So, I just want to say a big thank you to all those who participated.
Taking the time out to focus on your development in the current climate is difficult so appreciate the time that people are putting into this.
The aim is for us all to hone and improve our Power BI skills. There were some great shares around tips from the community and it would be good to keep this going. The challenges are open to all while there will be submission deadlines you can work at your own pace and submit at any time so don’t be shy, join in.
It was really hard to select a winner this week there was things in every report I liked, from standout colour schemes awesome use of visualisations, great calculations and even some awesome readable titles and field names!
The winner this week was @Walter a great effort that combined style and substance. Please get in touch to receive a complimentary membership that you can give to any one and we will hopefully be working to get your work shared across our social media channels giving you great exposure as a developer.
There were some highly commended efforts from @BrianJ , @michaelsampsonidis and @Greg
But seriously well done to all a great effort.
Feedback
This Challenge was all about creating a summary report, a task that for many BI developers will always find its way across the desk every so often.
Overall the quality of submissions was super high, and you all did an amazing job at extrapolating what was required from a very vague brief.
The brief was left vague as its not uncommon in industry to receive such an ask and as the developer its your job to extrapolate.
It was great to see this coming through in the development through measures and visualisations.
When creating summary reports it’s so important that you are actually summarising data.
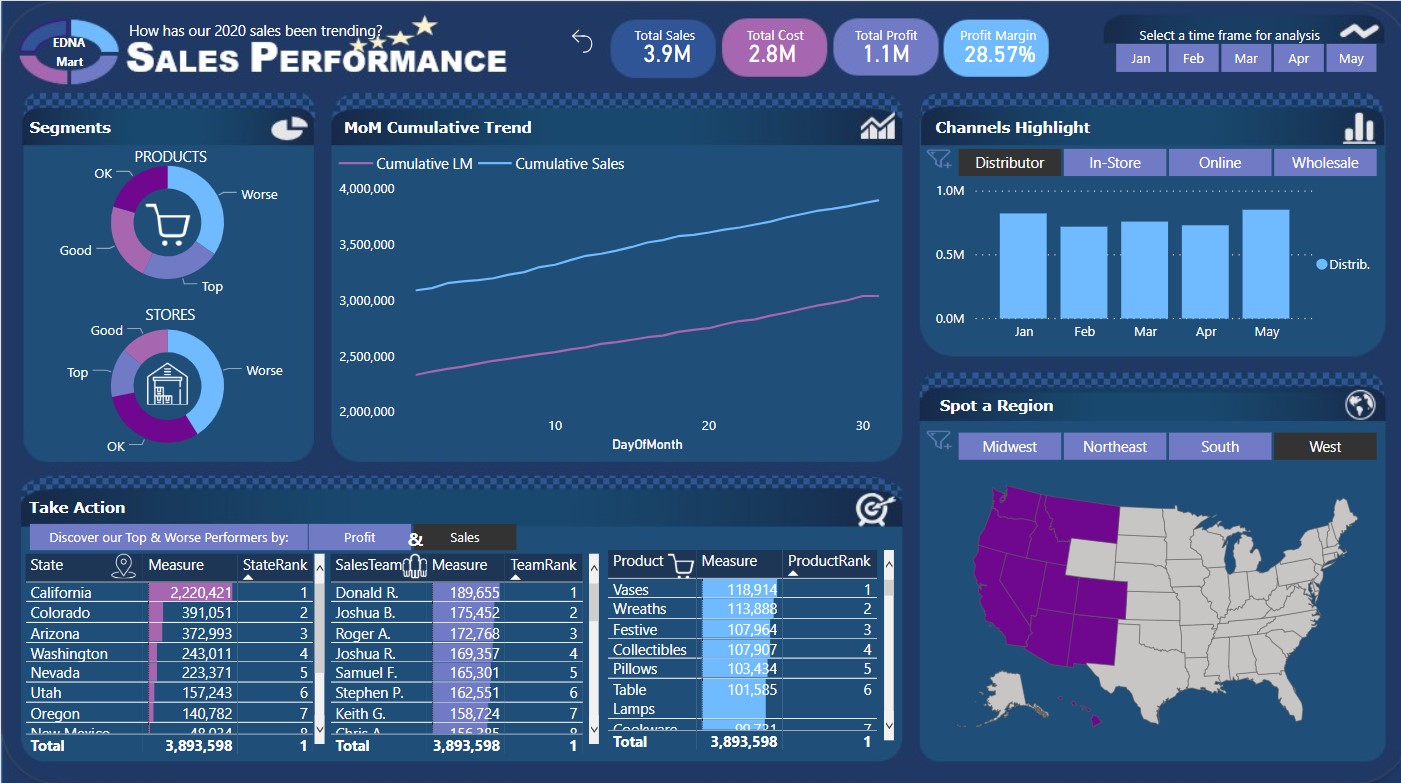
It was great to see the use of top and bottom across several the attributes. This is something that management like to be able to get instantly. ‘I should be able to see my “X” worst performing stores/products’ is a common ask. (Loved the report with the button to switch between top and bottom).
The use of segmentation is another great way of summarising and presenting data kudos to those who implemented this.
The use of a consistent and professional colour schemes was great to see. (The orange and grey monochrome were very nice)
I think with all the visualisations available sometimes we overlook basics like tables and its important to remember that sometimes that’s all that is required. It’s all about understanding who your audience is. If they like data in a table, give it to them in a table!
So just want to say a massive well done to everyone who took part in the challenge and producing a management worthy dashboard.
Here are couple points for your reference whenever you are summarising data.
Understanding the brief and your audience
One of the hardest things in delivering any technical solutions be it software, reporting or analytics is making sure that you truly understand what it is that your customer is asking of you.
In BI this can be a particularly difficult as different places have their own ways of working and processes for raising requests.
Regardless of where you are and how the request is raised there are some general principles you should try to incorporate into your thinking to aid your development.
Who is the report for? Are they data literate? These are key questions that the developer needs to be aware of. The answers to such questions will start to help build a picture around the type of request you have received.
Their position and seniority within an organisation is normally a good indicator as to how to shape the outcome. For example in many companies the higher the position the greater the responsibility and generally less time they have available.
Where is it being used? This is key as it will help understand where your requestee will be using the data and how this will shape your development for example is it to be used internally or Is it something that will be published externally.
What are they looking to achieve by using your product? An important question that will help you focus in on the mindset of your customer.
How often are they going to use it? Daily, hourly, weekly a one-off request.
You as the developer need to put yourself into the customers shoes and understand what the ask is.
Look and understand the data.
Before diving headfirst into development it’s good to just take a little bit of time to evaluate what you have been presented. Sometimes actually getting the data from source can also be part of the task however we will leave that discussion for another day.
The first point of call in any development should be for you to understand what is the data available.
A quick eyeball of your data source Excel, txt, SQL or any other data source to understand the granularity and data available.
Questions to be thinking about while looking at the data.
What is the structure of my data? 1 flat table, multiple tables.
What level of detail am I being provided? is there a single or multiple line being added for each transaction/event?
What are the dates available? Single or multiple date columns
What type of date entries are being provided? Month name ‘June’ or ‘12/06/2020’
Look for any numerical columns? Understand what it is that your going to be measuring and what’s available in this scenario we had ‘unit price’ and ‘unit cost’
What other attributes do I have available? Product, Sales Channel.
This doesn’t need to be an arduous or extensive task it’s just a great way for you to get your head in the game and high level start thinking about how you are going to approach the task at hand and what is required of you from a data preparation point of view. Is it going to require extensive modelling or is it already modelled? What attributes and values are available to you?
Getting stuck in.
Its time to start developing!
Can’t emphasise enough the importance of implementing the 4-step process and what we at Enterprise DNA consider to be the 4 pillars of any Power BI solution.
- Loading and transforming data
- Data modelling
- DAX calculations
- Report and visualizations
Reviewing your solution
Once you have completed your development, I always like to take a moment and just reflect on the brief and act as the user would with the report to ensure that all aspects of the brief have been covered. This can sometimes prove difficult as through development you can often get tunnel vision so always step away for a little while before reviewing.
Ok that’s enough from me.
Keep your eyes peeled for challenge 2 which will be released soon.
Any questions, requests or queries do not hesitate to get in touch.
Haroon
