@BrianJ. While I still believe this to be mostly true, the “probably” really needs to be emphasized here. For example if we have a Price and Qty columns in our fact tables we probably do not want to compute a total sales column (Price * Qty ). And actually having this type of column would have the adverse effect we are looking for. The reasons why are too much for a post or two, but I believe there will be something more substantial in the immediate future on this type of thing ![]()
1 Like
@Alvi WOW Awesome report. Your report shows that simple view is the best view.
Great Work!
Yikes. I do that all the time…
Very much looking forward to your deeper dive on this.
- Brian
Hahaha …That’s a nice one 
1 Like
Hello Forum,
Please let me share my submission for the challenge 5.
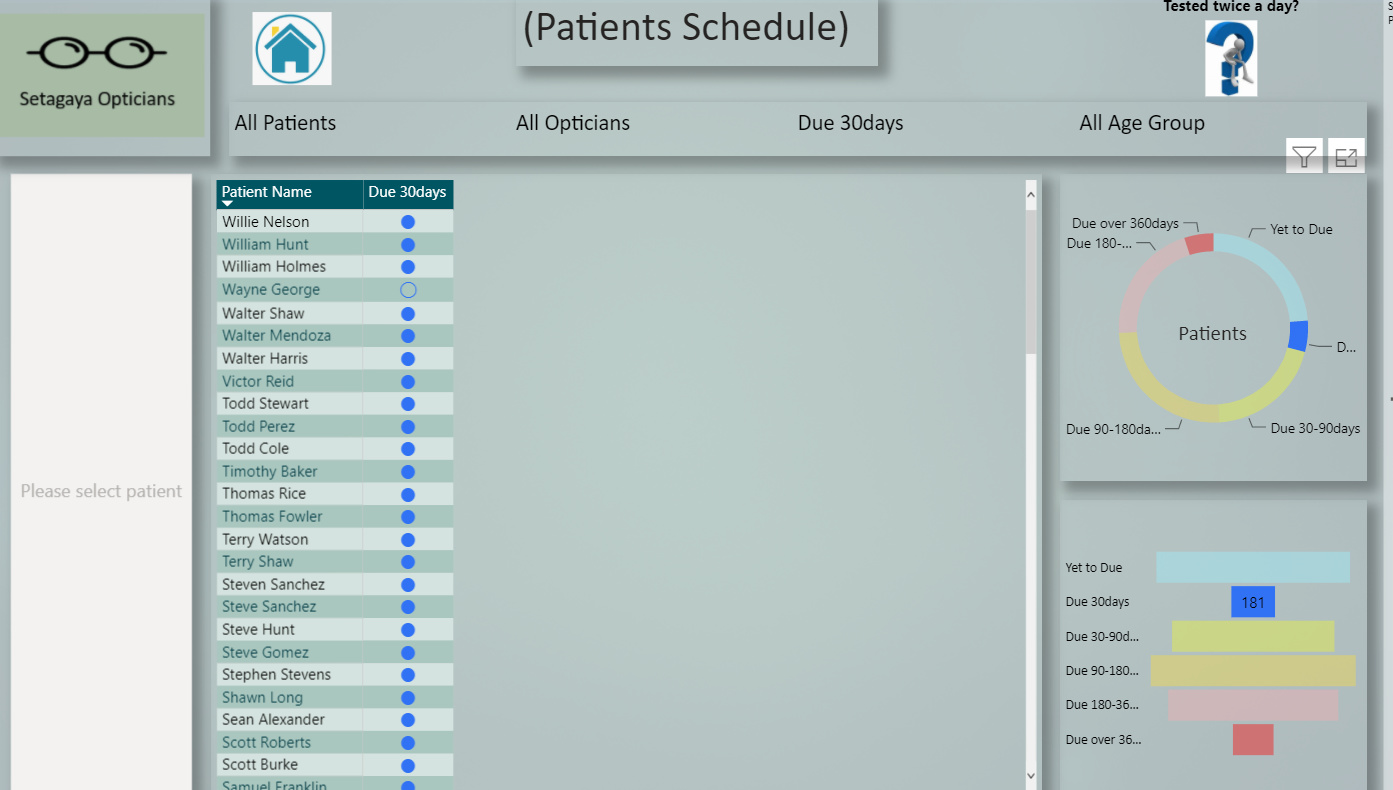
I tried to categorise patients by over due days reasonably as much as possible so Penny can use depends on her convenience.
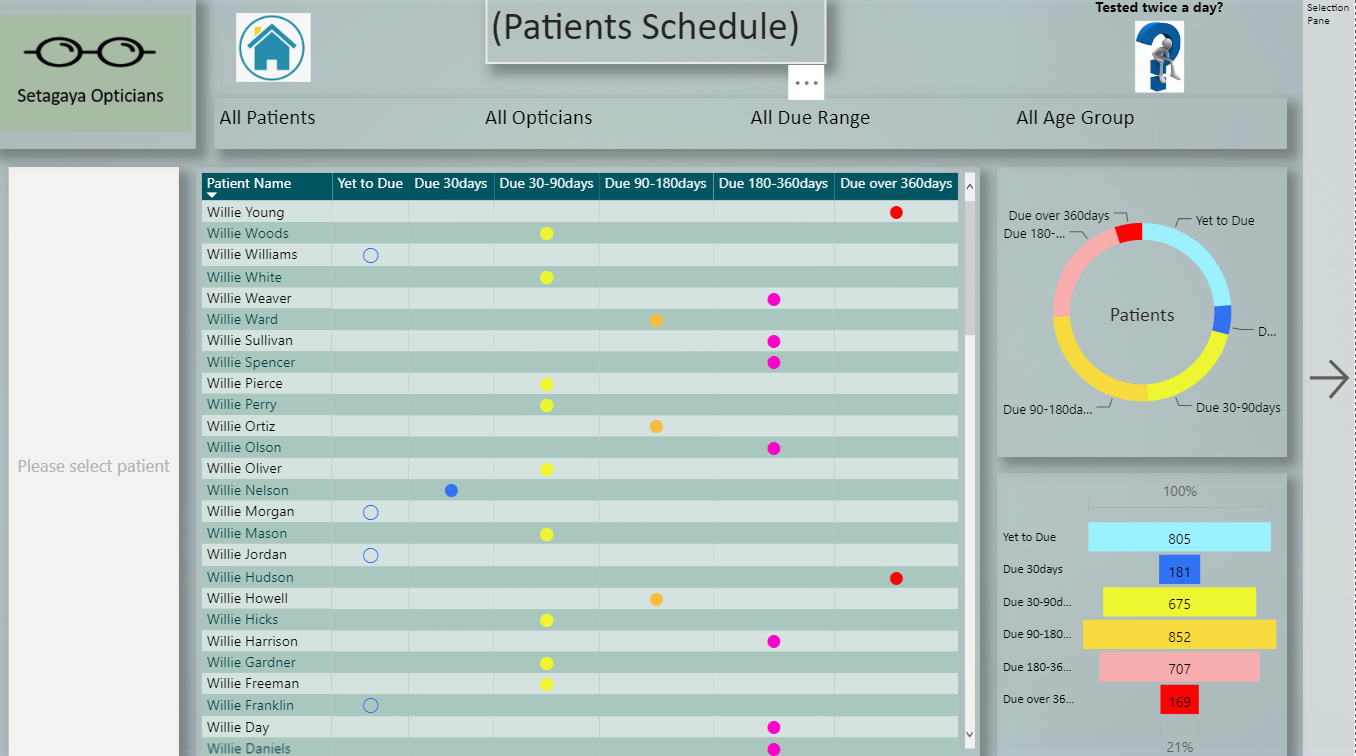
I have created visual tool tip before drill through to the patient details.The visual tool tip colour matches up with due days category colour.
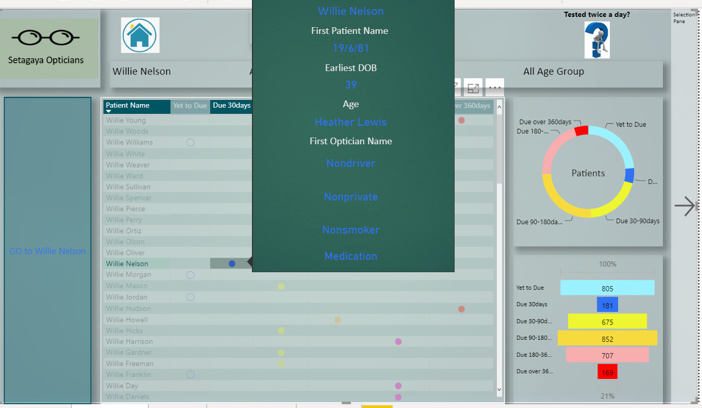
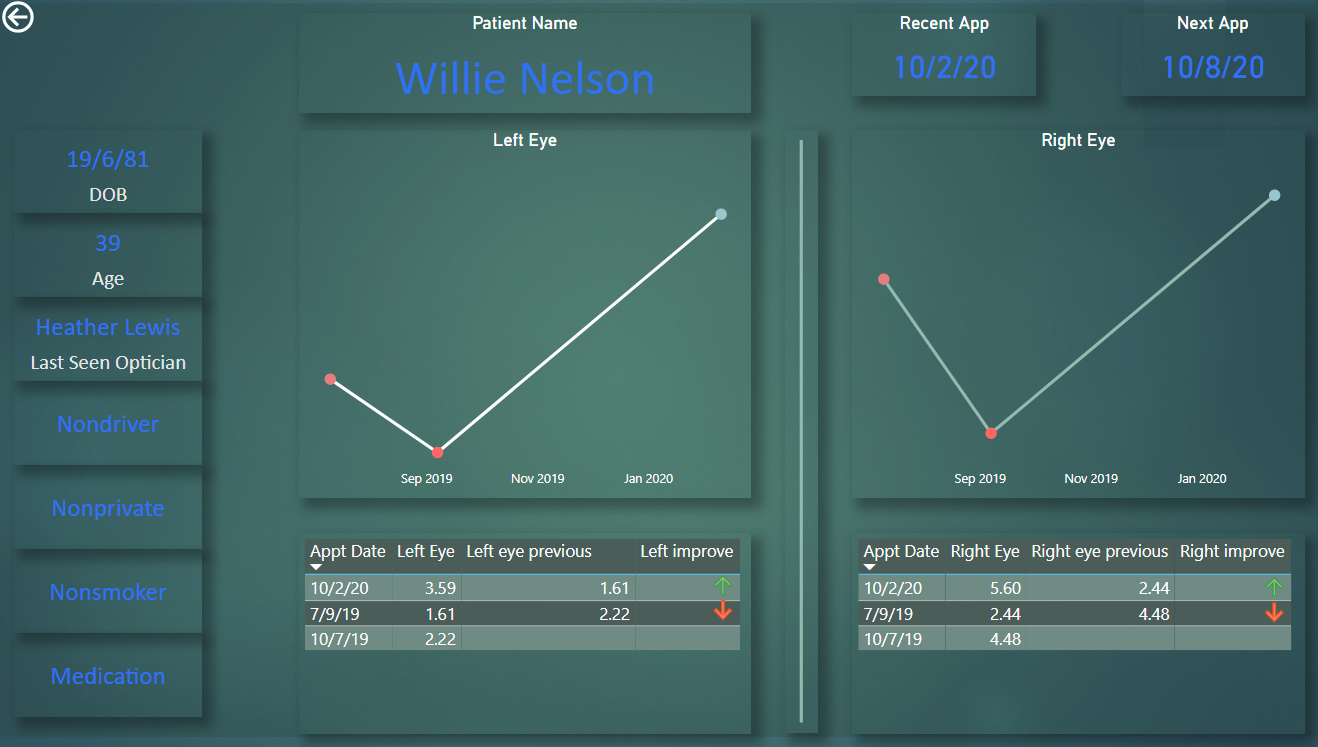
(Patient details)
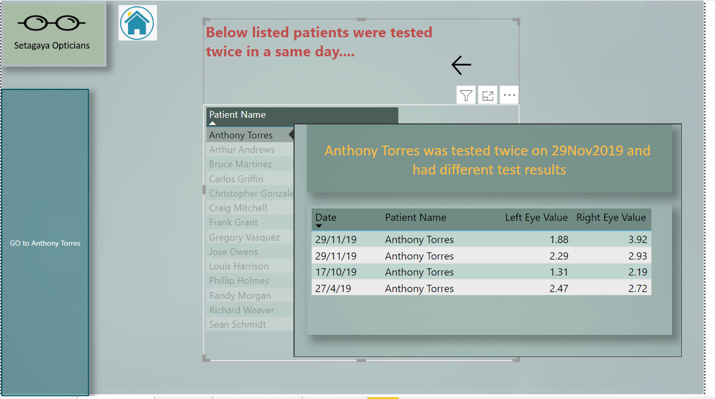
I just have noticed that some patients had tests twice in a same day with having different result so maybe Penny(Optical MGR) needs to look into.
Thank you so much all the forum members to let me share my report.
PBI link as below.
Regards,
Hideo
9 Likes
Wonderful job on this report! I love the use of color and the mechanics of the Patient Schedule module – in particular how you can filter by timeframe using the donut chart, and then activate the conditional drillthrough button after selecting a particular patient. Really efficient and intuitive way to manage a large volume of schedule data. The multiple values on the same day for the same patient is a great analytical find too - I think you’re the first one to uncover that.
Big thumbs up on this one.
- Brian
2 Likes
Thank you so much for looking details of the report.I really appreciate your comment and I’m very glad to know that the mechanics right guaranteed from our DAX super legend. This means a lot to me.Today became my another lucky day 
Regards,
Hideo
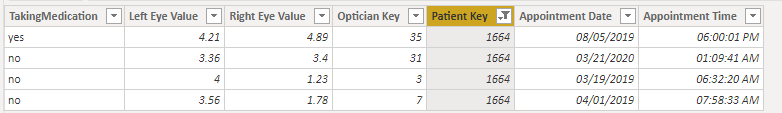
Great on the conditional formatting part and good observation in catching the dual testing same day. I also noted that plus the patients variables change in medications too. For e.g. in one appointment patient is not taking medicines but in another, he is on medications.
I was also incorporating Visual Header Tooltips (VHT) but I have found that Power Bi has limitations when it comes to visual headers.
-
VHT does not remain static and moves when we hover away the pointer. There should be an option to make it static so we can drill down on the data. It is similar to Hide/Show comments in excel but on different page.
-
There is only VHT per table. I was using VHT but now have decided against it for large data.
-
No gradient colors to choose from. Sometimes the dashboard looks kind of dull.
Hope Power BI makes advancement in Visualizations further.
1 Like
Thank you for looking at the report. It is nice to know that we found something common in the data.
In the report I have not use VHT but used “report page tool tip” (image as below).
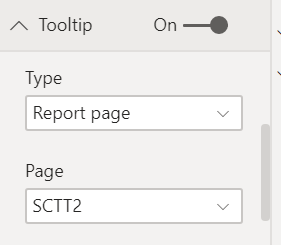
challenge5 (Hideo).pbix (3.9 MB)
PBIX file attached FYI.
I agree with you that visual should remain static depends on our set up also not using so often to avoid slow performance.
According to the colour, I have used dynamic colour measure.
I found this is quite useful(first time to use for me) so you may want to explore.Colour measure used in the report is as below.
We can use same multiple colours repeatedly.
ColourForOverDueGroupM =
SWITCH (
TRUE (),
[Due DaysM] < 0,"#3172f5",
[Due DaysM] <= 30,"#3172f5",
[Due DaysM] <= 90,"#eef531",
[Due DaysM] <= 180,"#f7bd3e",
[Due DaysM] <= 360,"#fc03ca",
“#fc0303”
)
I like your report challenge #4. Highly professional use of bookmark.
You can be a winner if same quality of report as last time.
All the best
Hideo
2 Likes
Thanks for explaining in detail… Yes I know you used report level visual headers, they are quite effective but still limited. This time I have gone down the rabbit hole and have challenged myself to do something different. Let’s see how it will turn out. Fingers crossed!!
1 Like
Thanks for your comment @MudassirAli
Thanks @AntrikshSharma for your comment. I am a relative newcomer and my goal has been to improve my submissions with time and increase my learning
1 Like
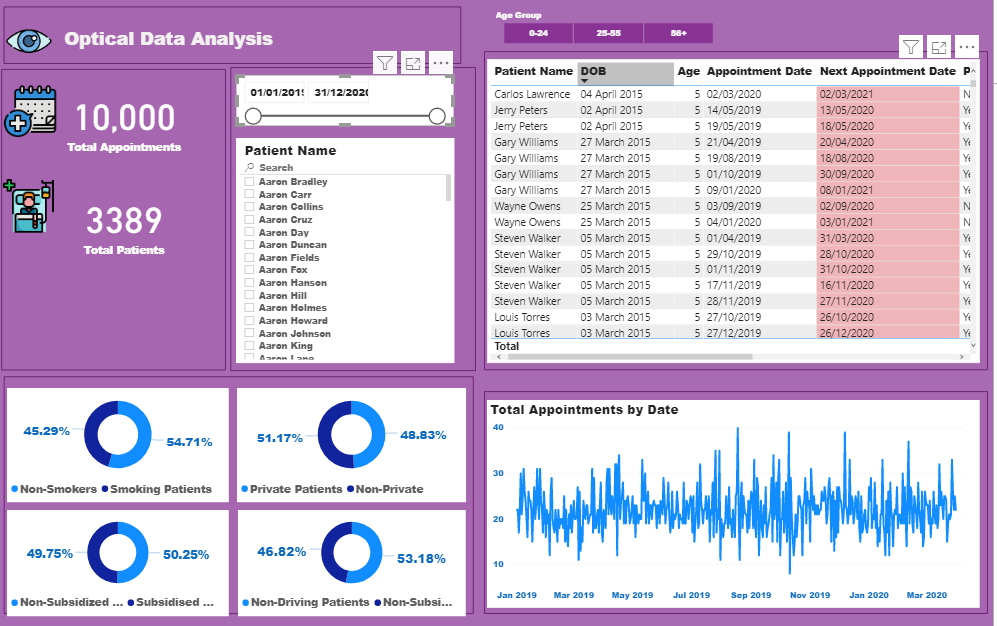
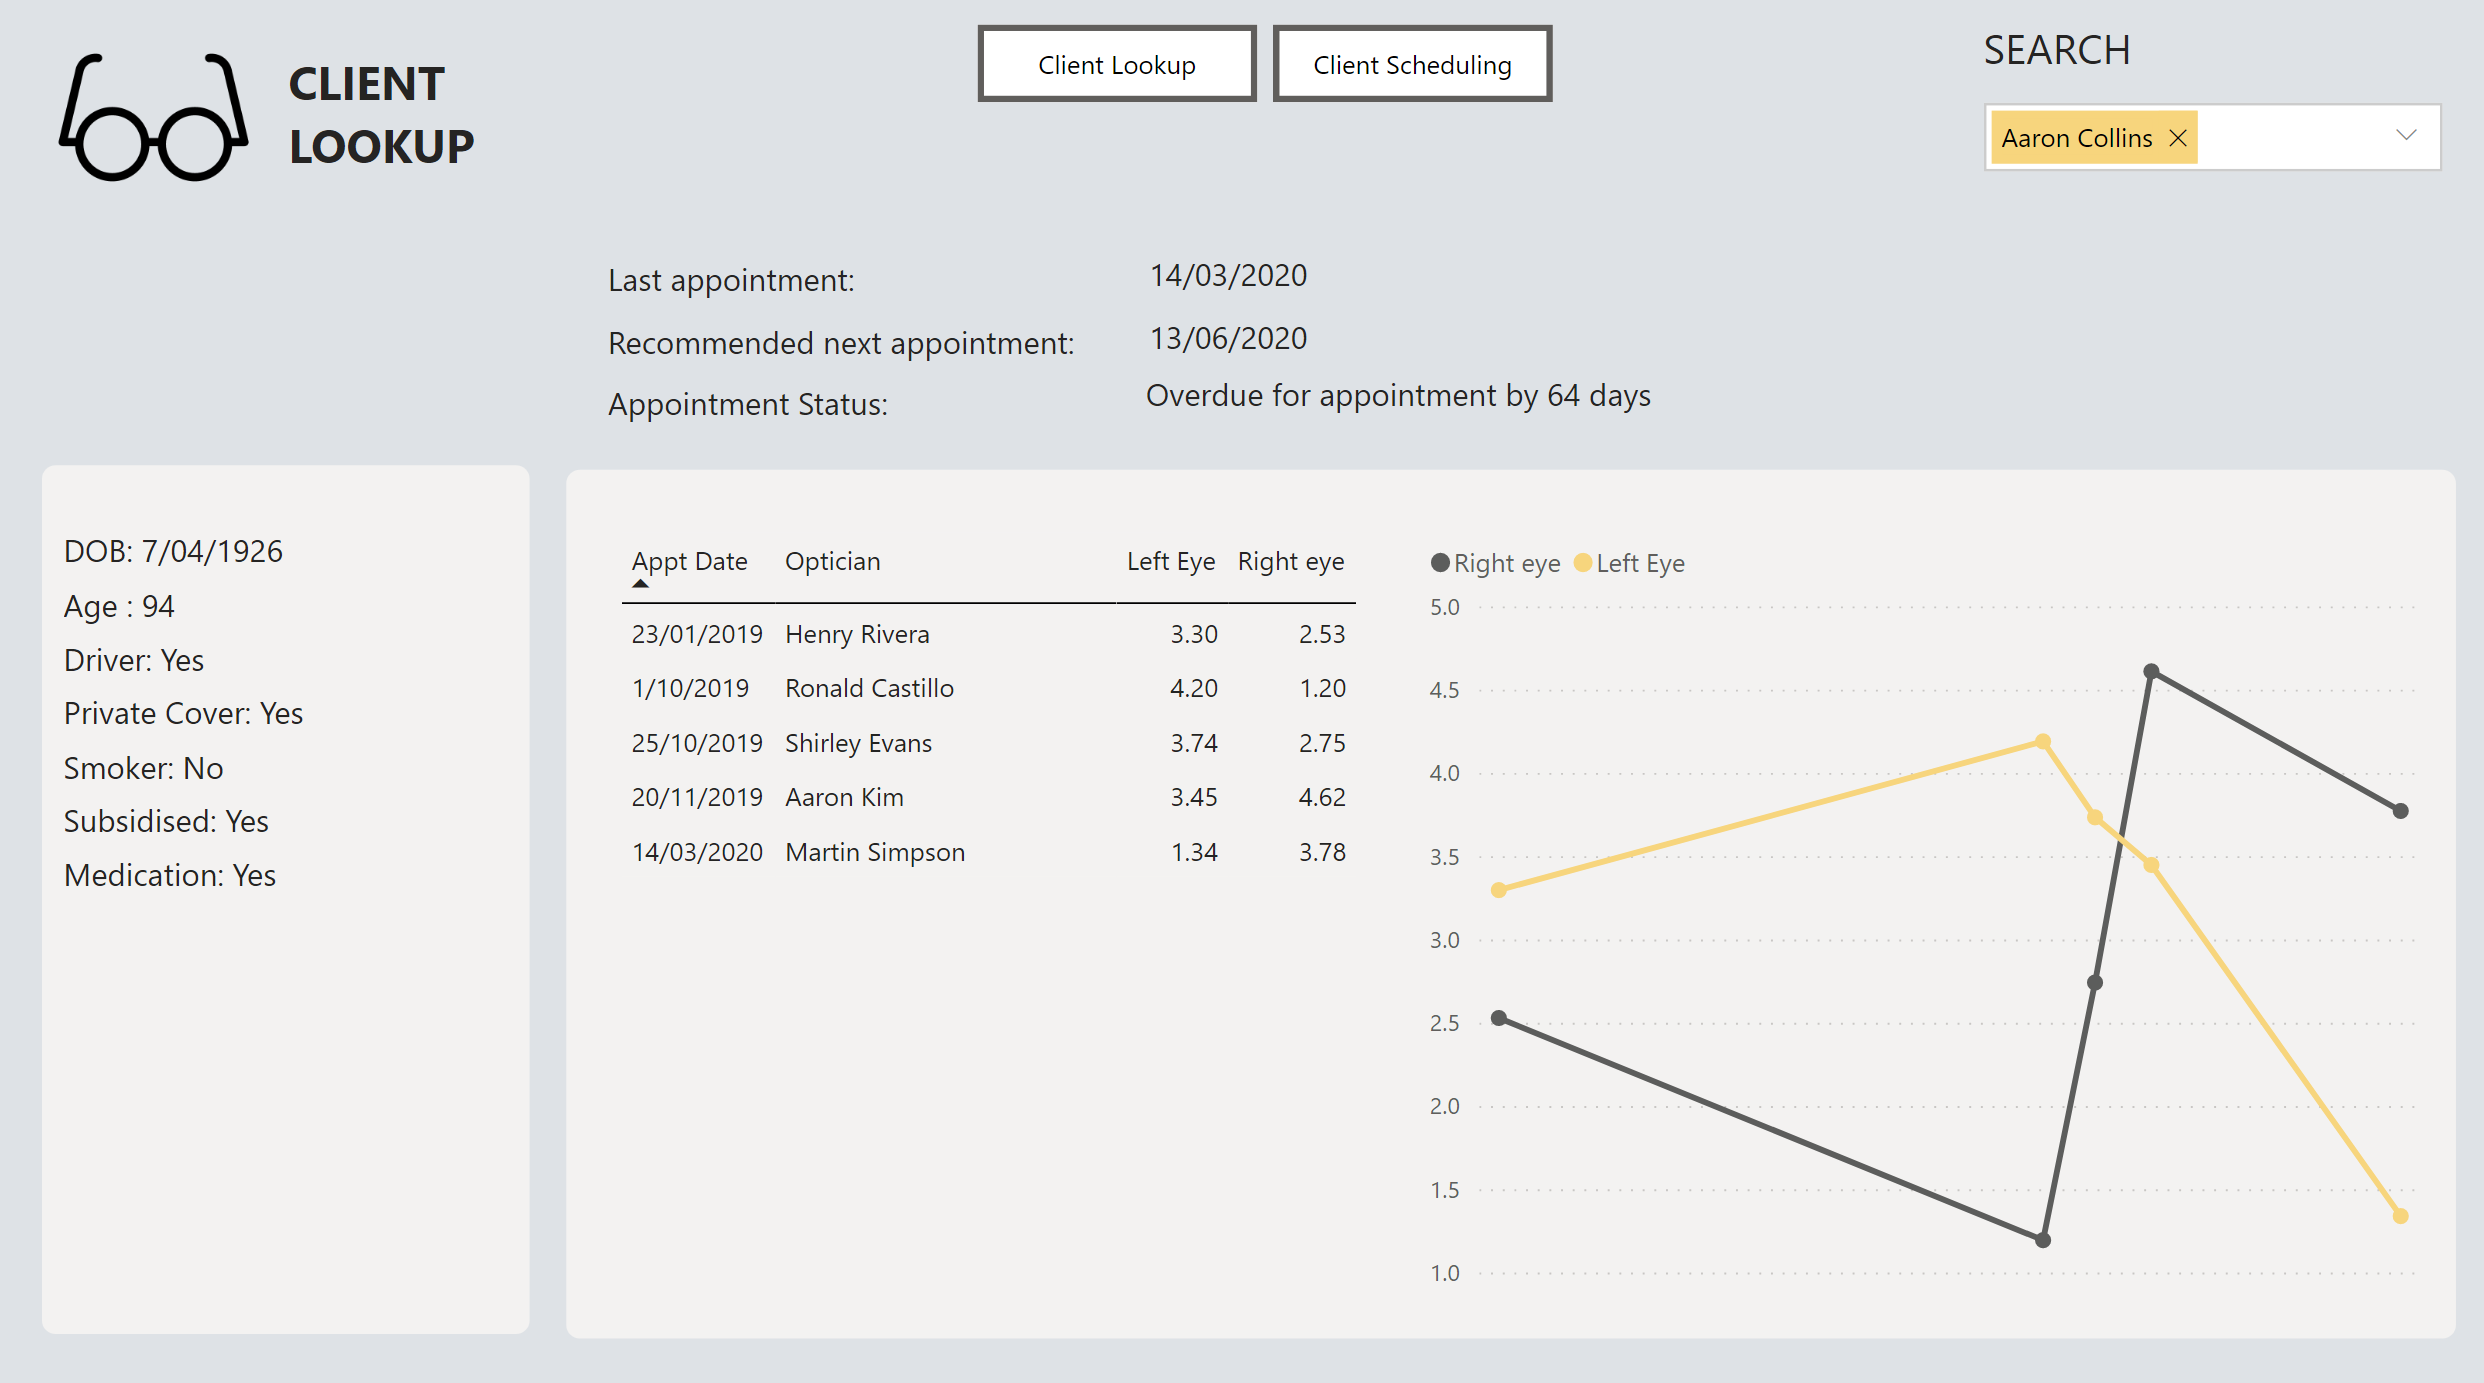
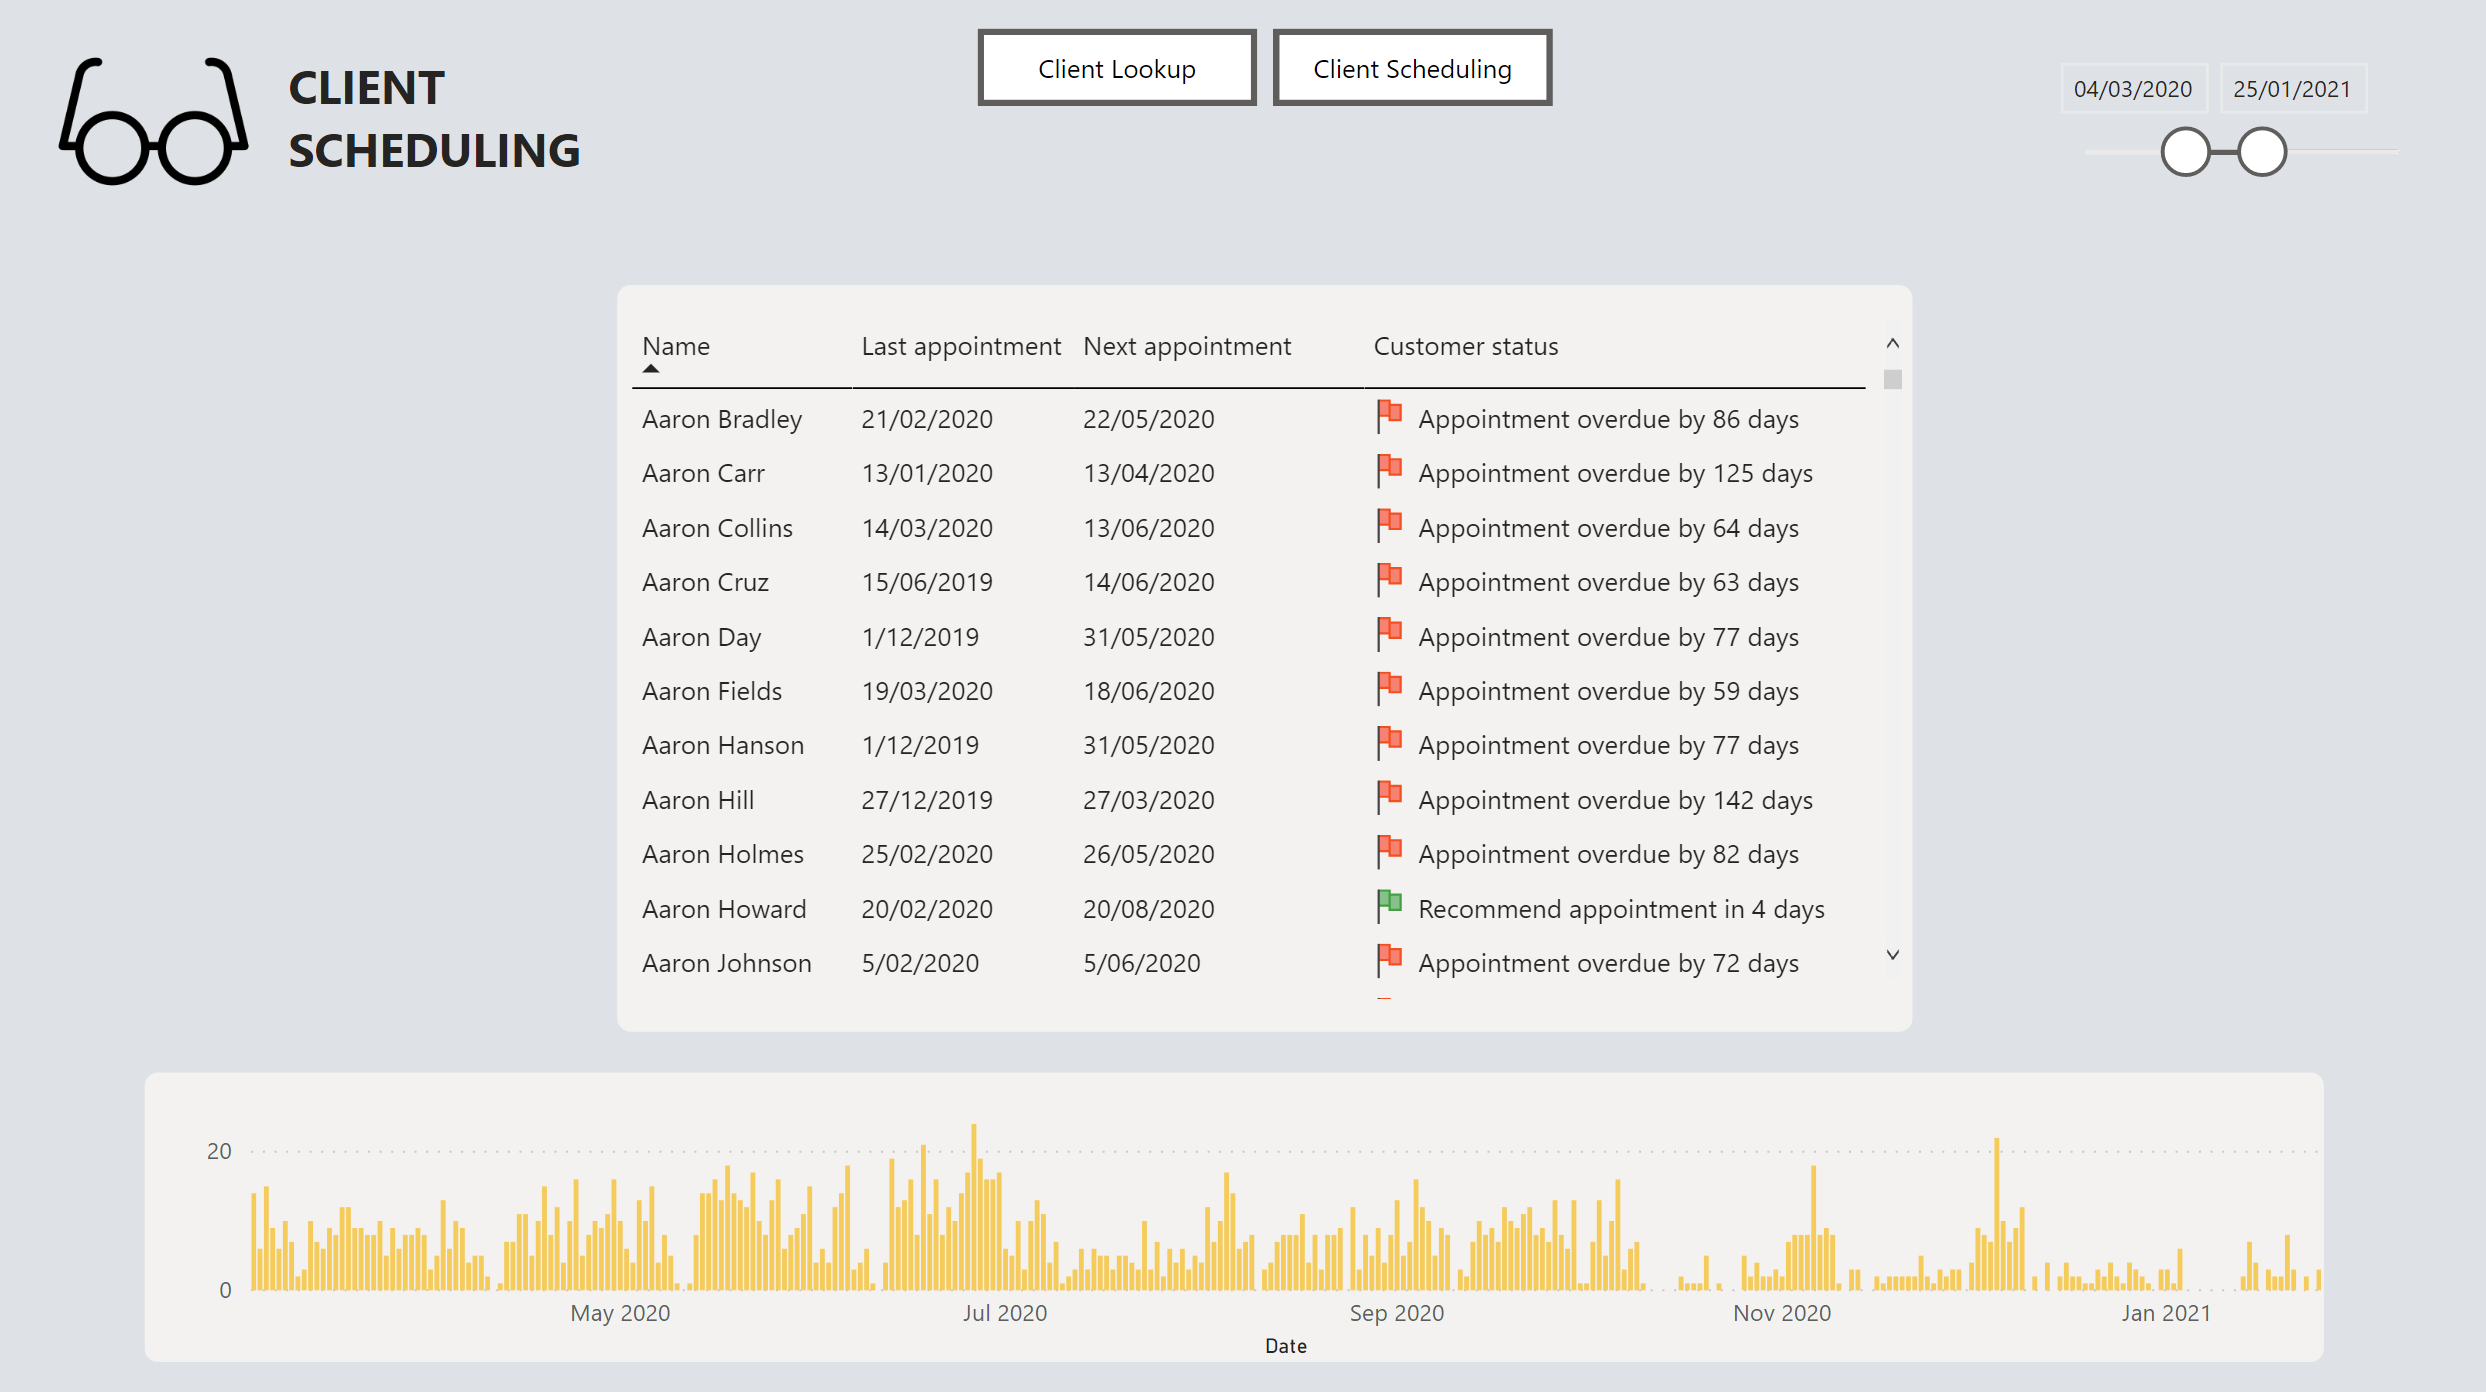
Hello everyone, i am a newbie and submitting for the first time. I am here to
learn and master Power BI so will appreciate any feedback
Features
- Optical Data Analysis showing the
- Count of Appointments within any selected date range
- Count of Patients within any selected date range
- A comparism of Smokers/Non-Smokers, Private&Non-Private Patients,Subsidised&Non-Subsidized and Driving&Non-Driving Patients
- Total Appointments over time
- A list of Patients with their next Appointment dates
Issues
I had wanted to show the counts and list of Patients with Appointments in the next 7 and 14 days from any selected date but had difficulties doing so. Any ideas on doing so, will be greatly
appreciatedOpticalAnalysis.pbix (951.5 KB) The pbix file is attached
6 Likes
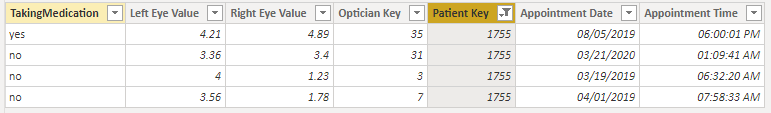
@haroonali1000 I was looking at the patient data and for Shawn Hayes there are different values under IsSmoker, is this dependent on the visit such as post optician visit he stopped being a smoker, or there should only be a same value for IsSomker? Or maybe they are 2 different people?

all the 8 rows related to him are same.
1 Like
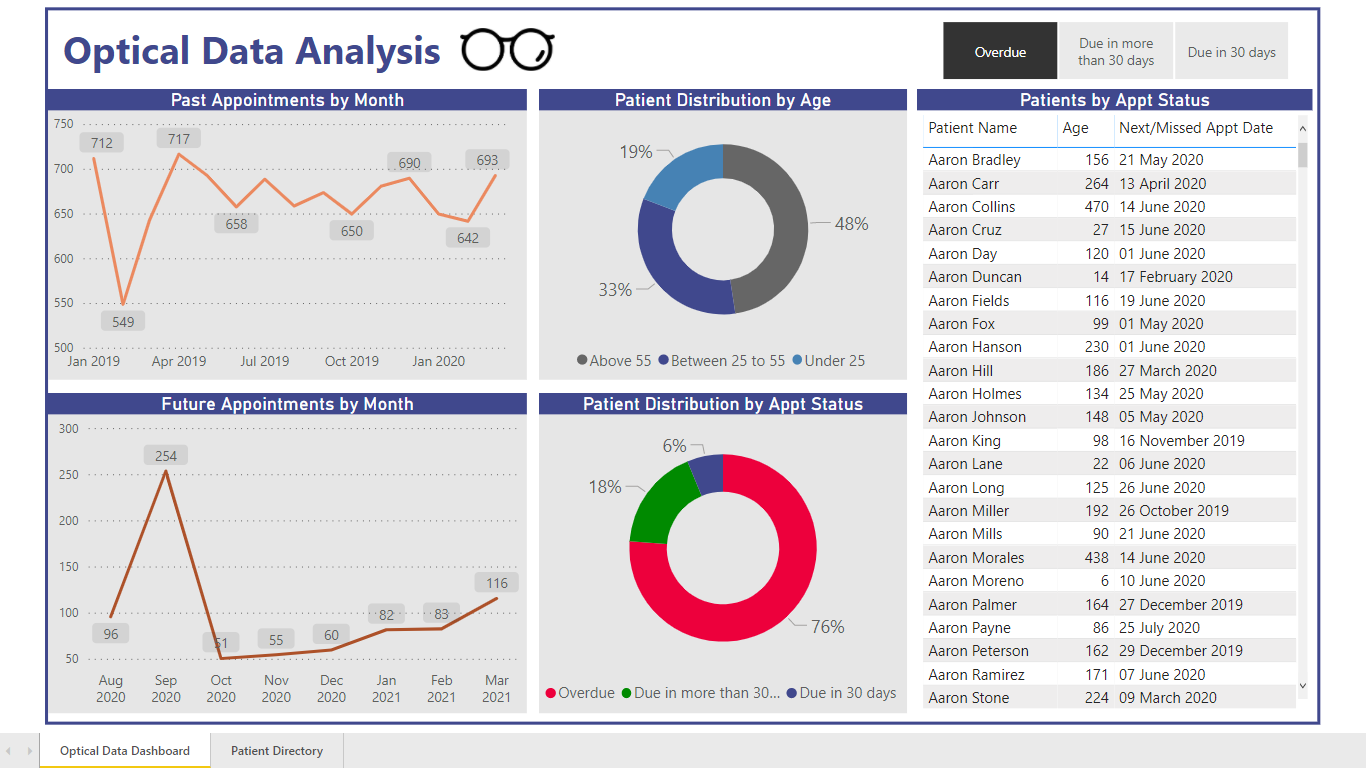
Dear all,
Please find below my submission to Challenge n 5.
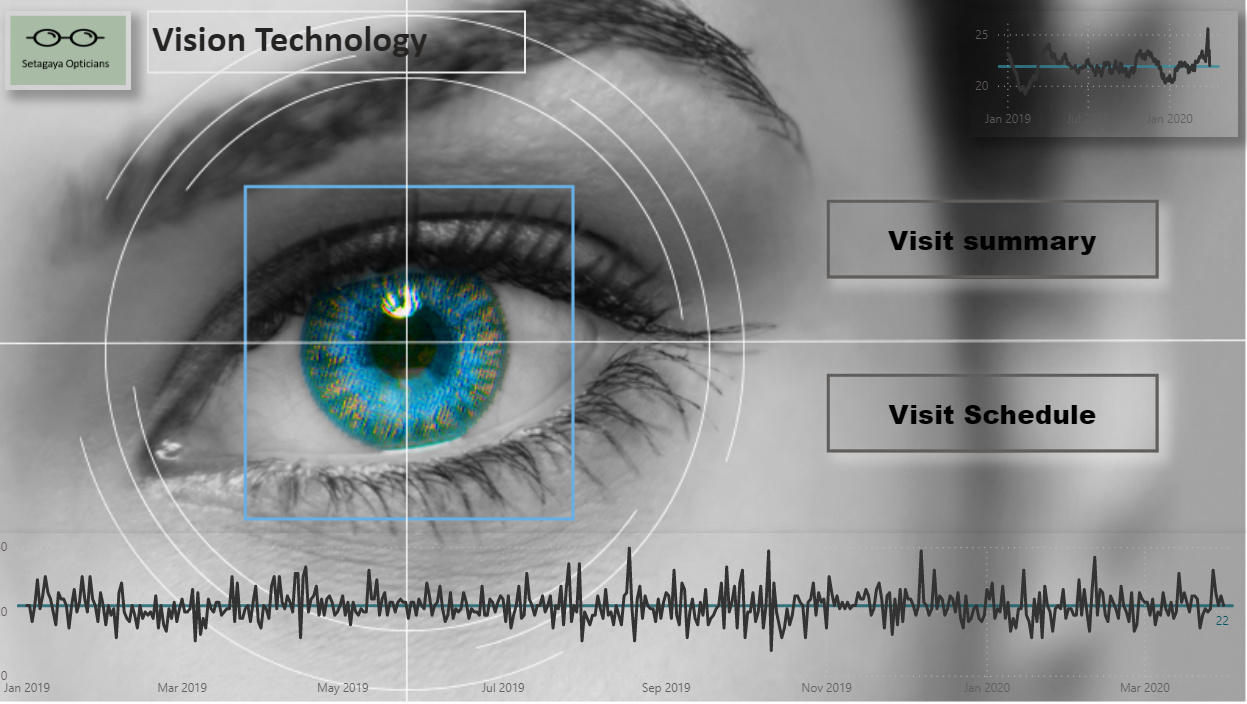
I used the visual identity of a real optician existing in Paris, France. I wanted to create a report clear and visuals to match the needs of this week’s challenge. I extracted the main colors from the logo and images the company uses, and incorporated in the design.
I used cards with full transparency to create a lenses “effect”.

I spent quite some time to create a menu that includes a “safe click” so that it is very natural for the user to open/close the menu. I chose to create a menu as I believe it is easy and elegant to create in the corporate environnement. It is intuitive for end users and it gains a lot of space on the page. Another advantage is that it is easily evolutive. What would you expect from Penny when she will understand the importance of Power Bi? I suppose she will ask 1000 new things. This is the effect of using Power Bi in real life. All your reporting dreams come true
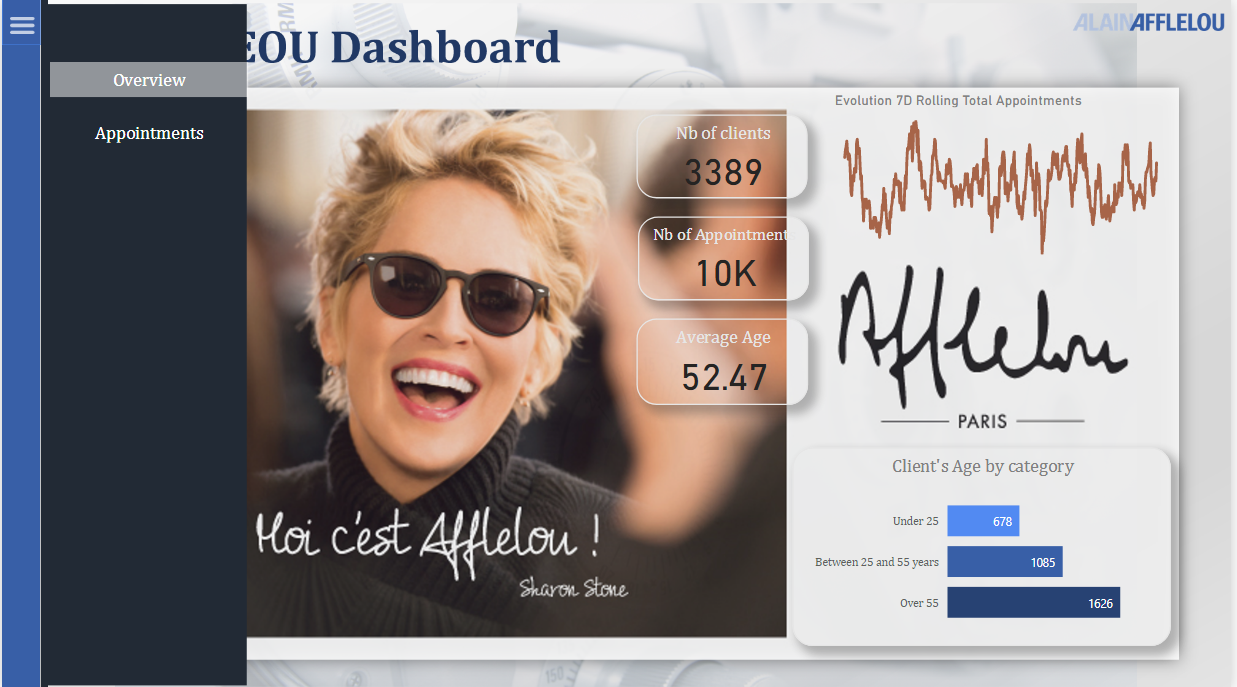
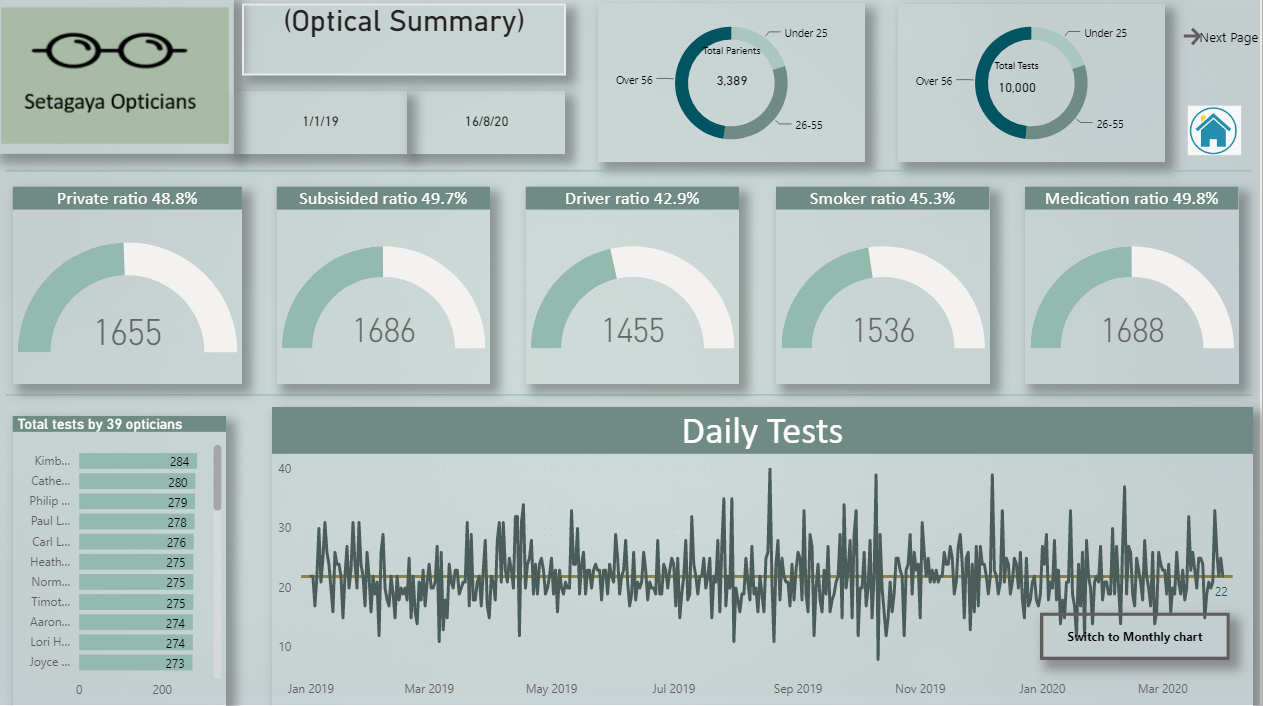
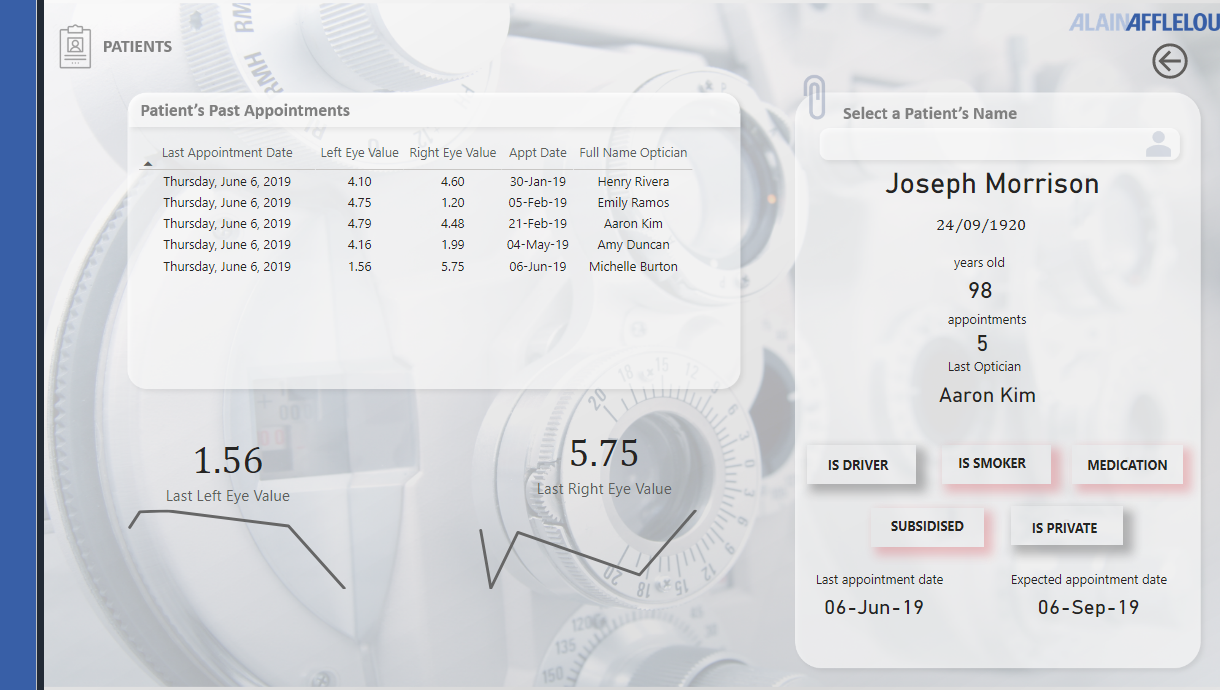
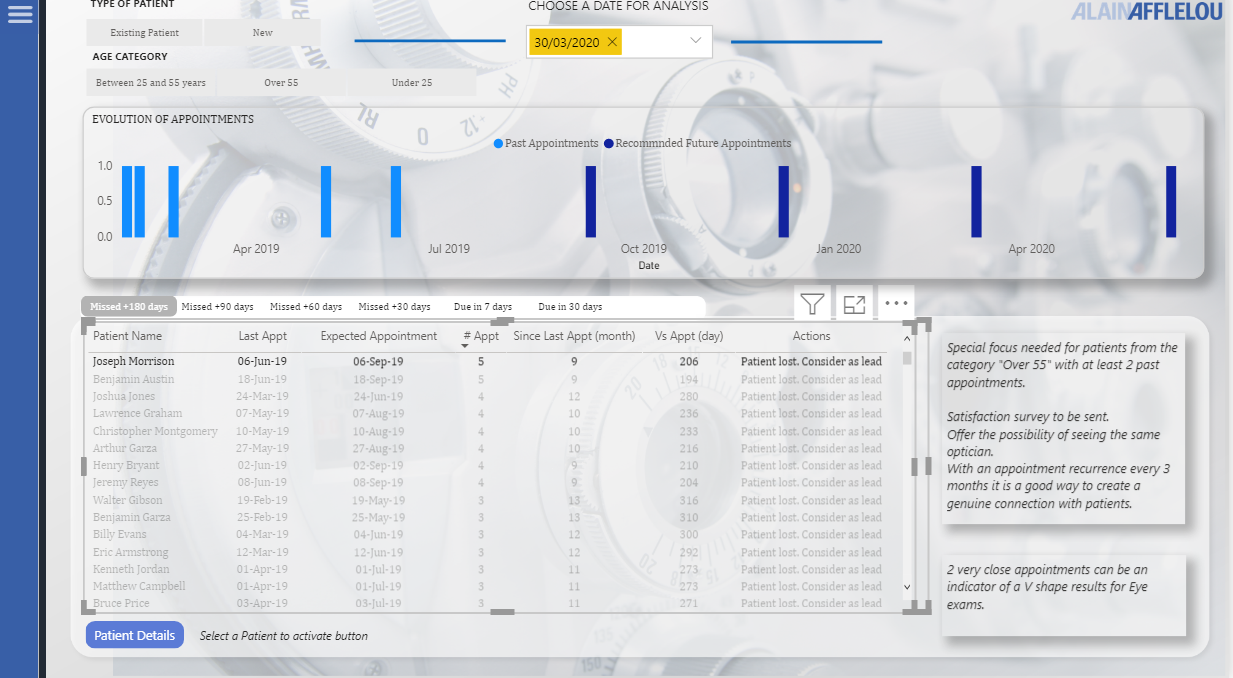
The structure of my report is the following: Overview, Appointments and Drill Through Button to Patients.
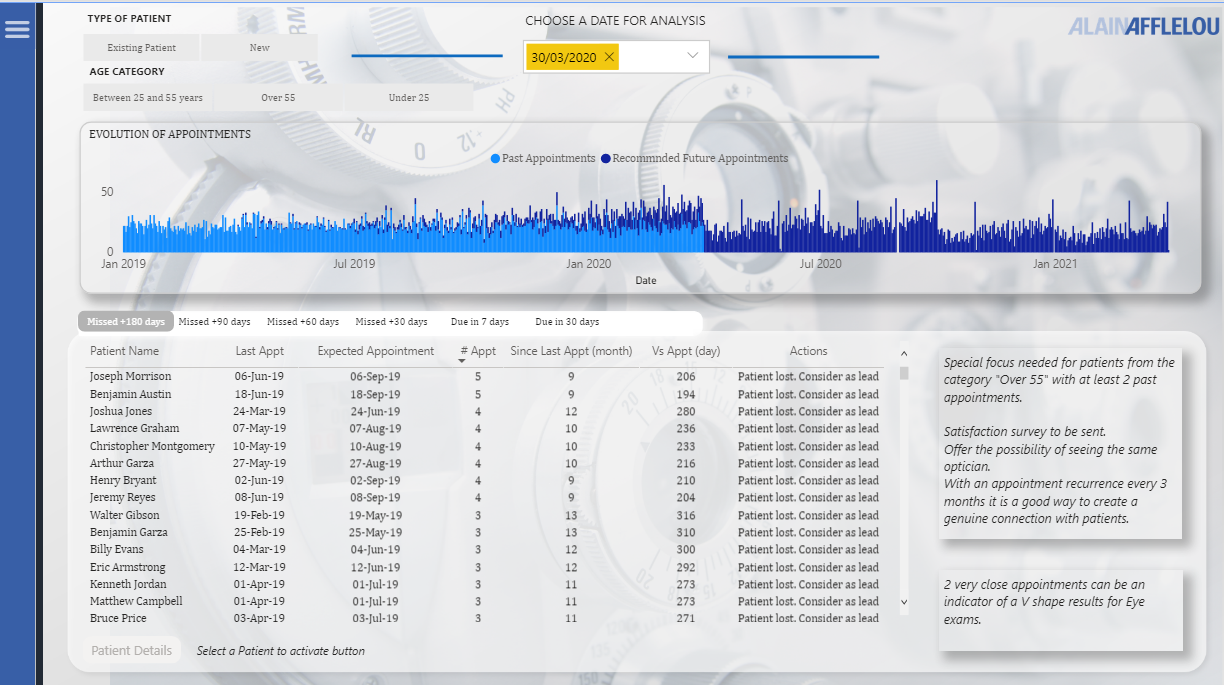
From the analytical point of view, I made 2 choices that made my life much more complicated:
- Give the possibility to the end user to select what day is TODAY! All formulas of course will recalculate based on the decision.
Why did I do that? First, because I observed that the last appointment was realised on the 31st of March 2020. So “Today” in the analysis should be 1st of April. Second, I expect the analysis to be on a daily basis eventually, but before automization of the datasource, there is need for more flexibility. - I wanted to calculate more than 1 future appointment by patient. I decided that I want to see 1 year of appointments by category. That means 1 future appointment for a less than 25 years old, 2 future appointments for the next category, and 4 appointmens for the elderly patients.
What I did not expect was that 18 patients will change the category in one year. That means I need a second round of calculations to adapt the future appointments.
And I wanted to create this in M. SO… As you might expect, it did not work that well. (Put me in the pre orders list for the Definitive guide of M with @Melissa :D)
In order to calculate all this I used an external ETL and tried to find the mix between what can I create inside Power Bi and Transform Query and what I calculate in static mode in the dataset.
I found some nice findings because of that:
-
Additional efforts should be made to analyze +55 years category with an historic of at least 2 past appointmens
-
It is very common pattern for patients that churn and never came back to experience 2-3 very close appointments.
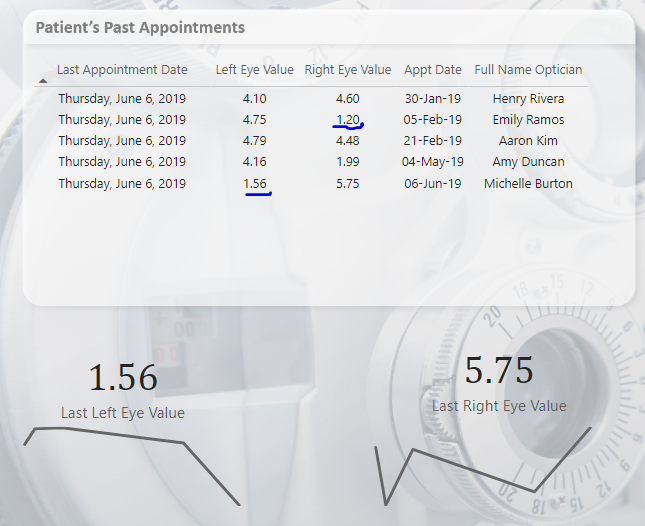
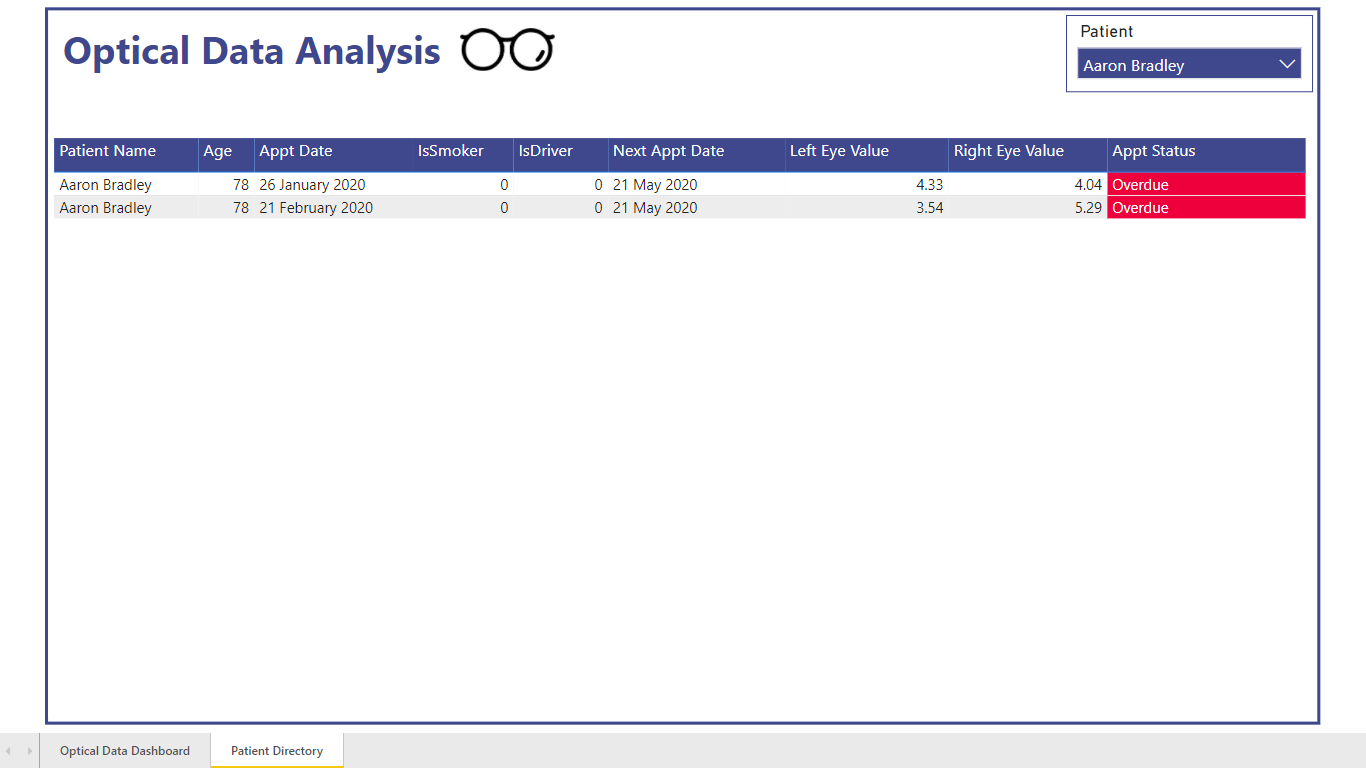
My report make it easy to visualize and explore the phenomenon. I the print screen below I focus on the Overdue +180 days. The curiosity is to drill down to the patient’s list and what do I see? The splendor of V shape or my “Eye Result Shock”. In this case particulary we see that because of a very bad result on the right eye on Feb 5th, the patient chose to do a second test in the same month. The results were quite different. Then a normal test and after another shock that made the patient never come back. -
My last finding and recommandation is to focus on +55 category and ask them if they want the same optician for the following appointment. With an appointment recurrence every 3 months it is a good way to create a genuine connection with patients.
(Talking about opticians, there is another analysis to be done on their performance, as many have 1 appointment per day which is quite uncommon in the real life. I did not go further on this idea as I considered the data to be too anonymized…)
Last but not least, I used an “easy” way to present smokers/not smokers etc in the patient’s page. I used conditional formatting for shadow’s to activate color when the value is 1.
That’s it! Not an easy challenge! Thank your Edna and Entreprise DNA team,
Best regards,
Alex
9 Likes
My submission for 5th Challenge. This is the first Enterprise Challenge that I took part in. Loved working on the dataset.
5 Likes
.
Sounds like a nice Power Query challenge ![]()
In my submission I explored using a recursive function, to return a future date - you can find that here.
.
The M function below generates a list of dates, so you can extract whatever you find interesting ![]()
( myDate as date, dateDOB as date ) as list =>
let
    BufferedInterval = Table.Buffer(Interval),
    curDate = Date.AddMonths( myDate, Table.SelectRows( BufferedInterval, (BT) => BT[Age] = Number.RoundDown( Duration.TotalDays( Date.From(myDate) - dateDOB ) /365 )){0}[Interval in Months] ),
    Source = List.Generate(
            () => [x = 1, y = Date.EndOfYear(Date.AddMonths(Today, 12)), z = curDate],
            each [z] < [y],
            each [x = [x] + 1, y = [y], z = Date.AddMonths( [z],
                Table.SelectRows( BufferedInterval,
                    (BT) => BT[Age] = Number.RoundDown( Duration.TotalDays( Date.From( [z] ) - dateDOB ) / 365 )
                ){0}[Interval in Months]
            )]
        ),
    CreateTable = Table.FromRecords(Source)
in
    try CreateTable[z] otherwise {myDate}
.
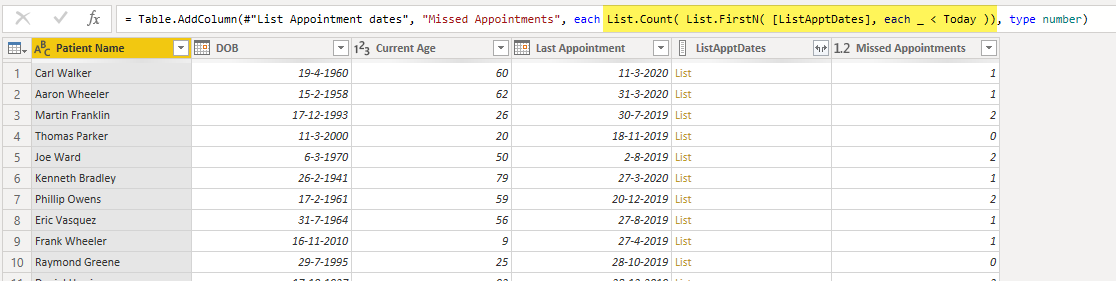
It generates a list of dates from the Last Appointment date until the End of Next Year based on the Age Interval. Once you have this you can extract several insights, for example:
Count the number of missed appointments:
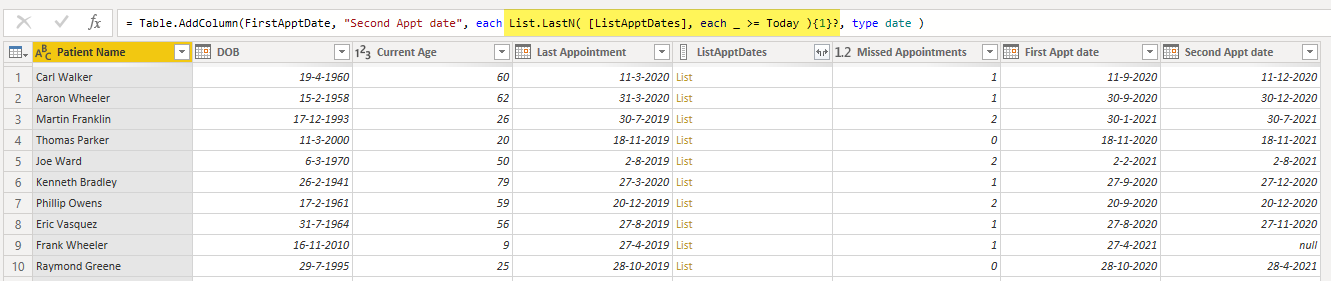
Get the dates for Next- and Follow up Appointments:
.
Here’s my sample file: eDNA - Challenge 5 - Optical Data, create appointments list.pbix (198.3 KB)
I hope it helps you on your power query journey ![]()
7 Likes
Hello everyone,
Below you can find my participation to the challenge:
First I created the Landing Page, where the end user can select on of the three Objects

Starting with the Overview for some general statistics:
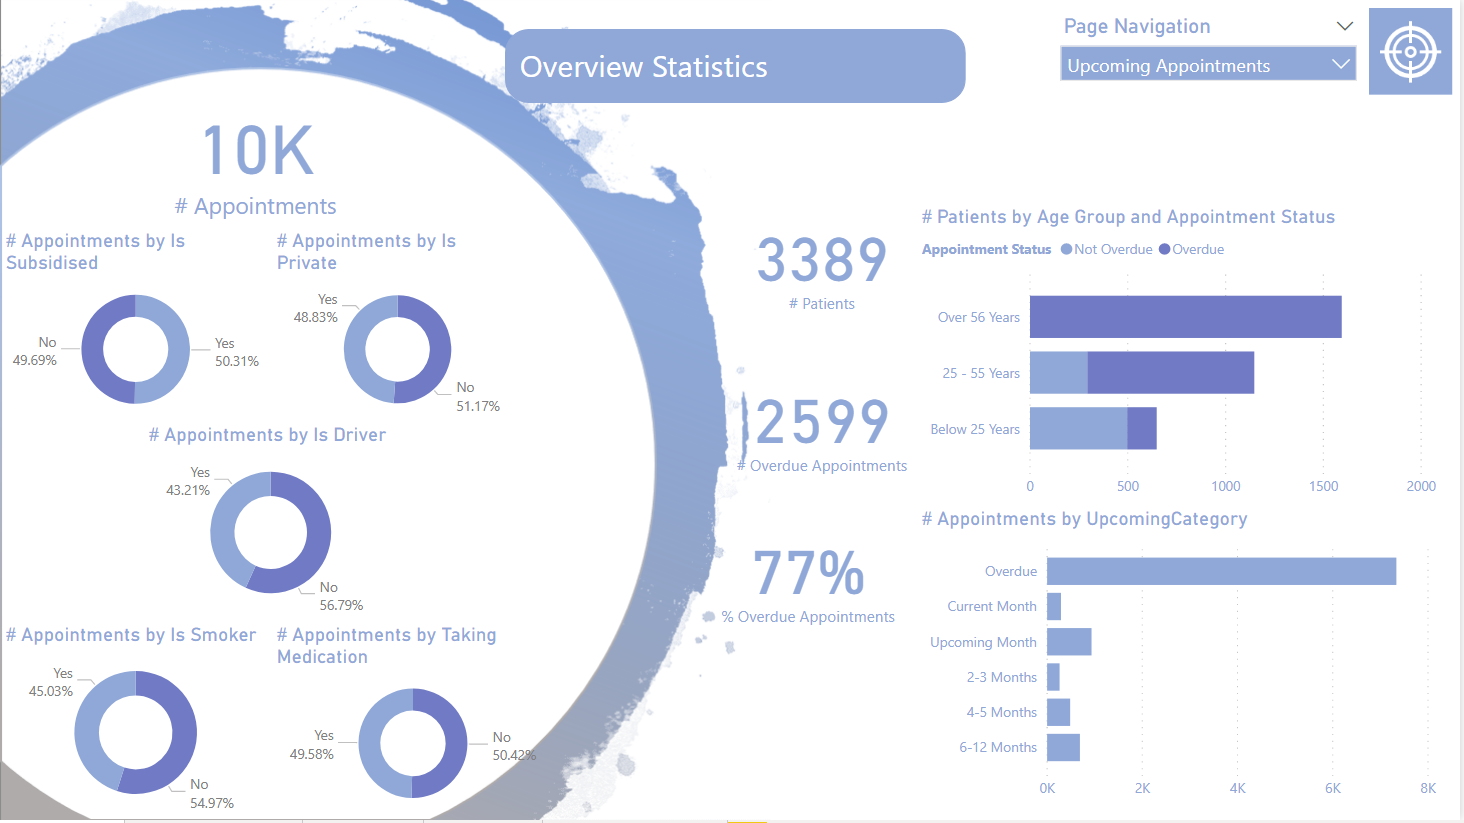
Then the Upcoming Appointments with the specific groups:

and the possibility for a more details view on each patient:

And last part the Patients Details with the option to search each client if not from the previous page :

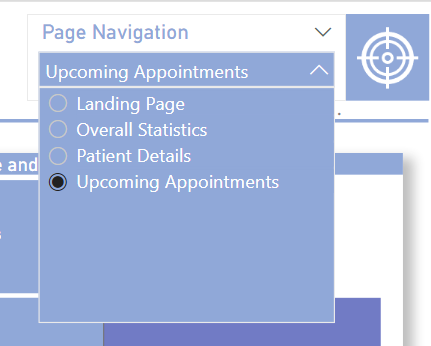
In all of them I have added a slicer for better page navigation :
Hope you like it !
Congrats on the rest participants who did an amazing job!
Michael
7 Likes
WOW, so amazing reports. Too sad I couldn’t participate this time, I was so busy with another project the last three weeks. I am expecting the next one already. congratulations to all. I do not how you can choose just one winner. Good luck everyone.
2 Likes