@MudassirAli I am no match for you guys!
I ain’t buying brother.I know what game you are trying to play here…We won’t drop our guards.
1 Like

1 Like
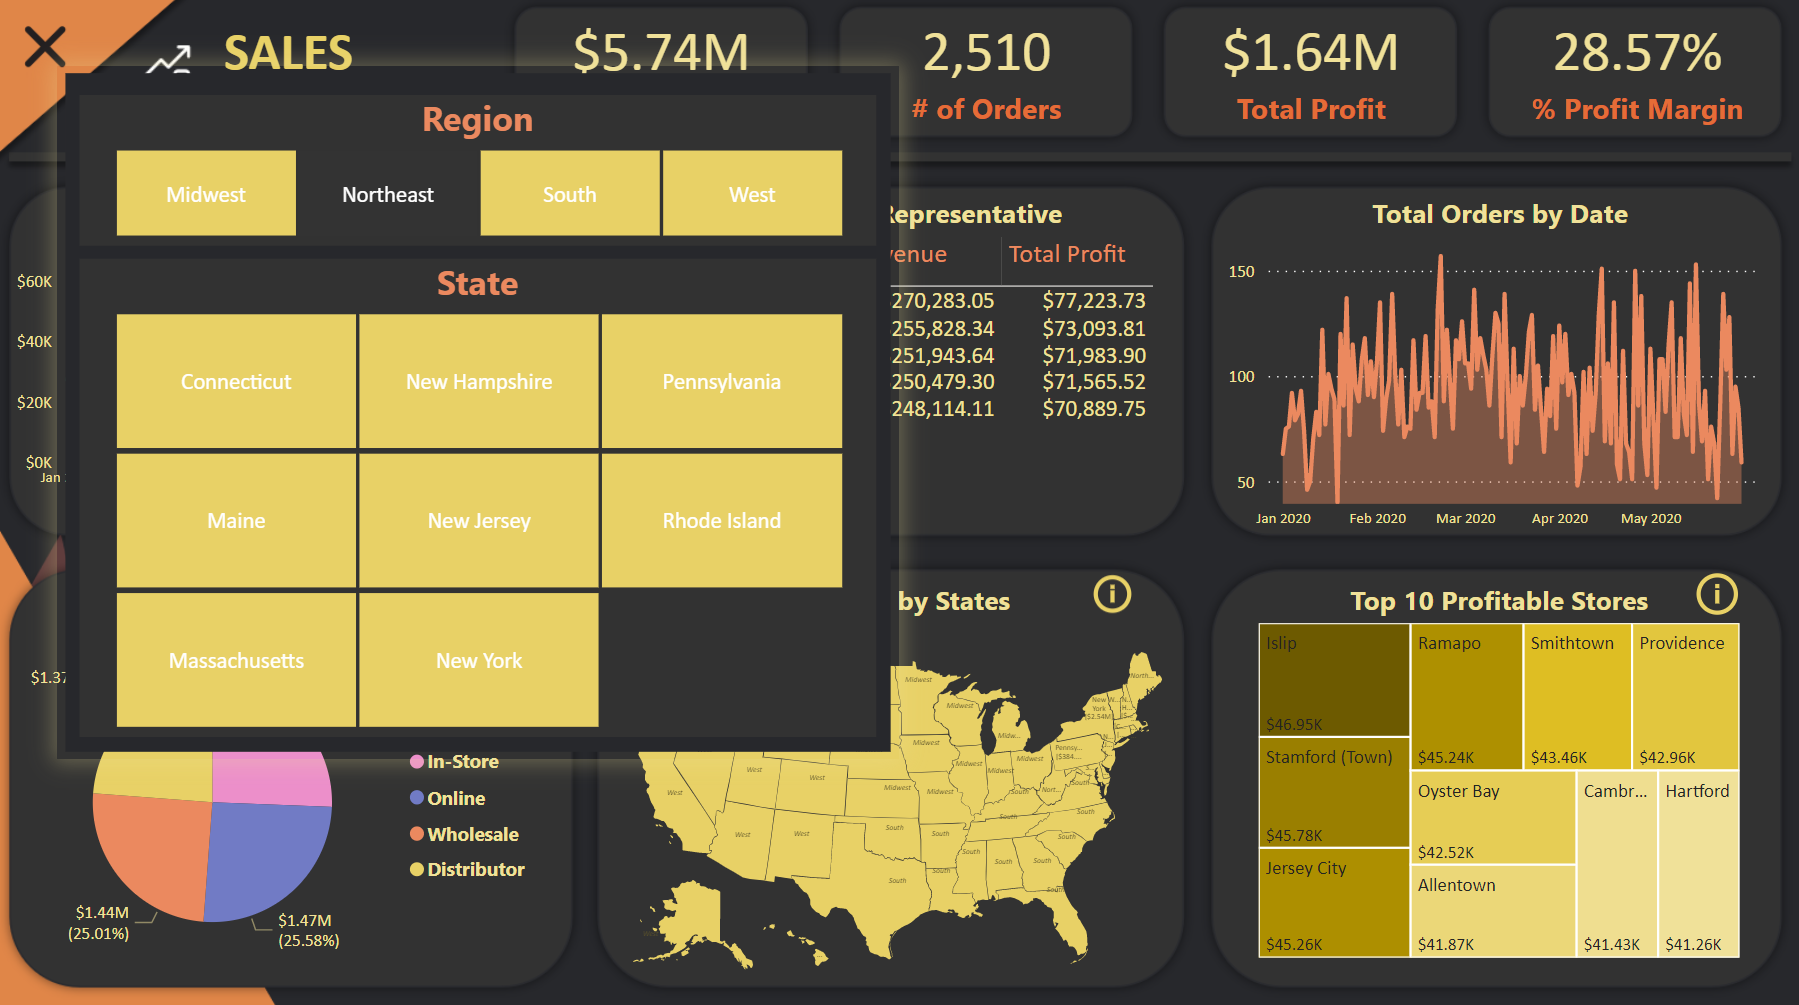
I agree - fantastic first entry. Sharp color theme, excellent analysis, excellent use of tooltips (including really innovative dump filters tooltip).
My one constructive suggestion is that there’s a lot going on on this page, but it’s not clear what’s most important for the viewer to pay attention to. That should stand out - and can be communicated by size, position, color and/or explicit text.
Look forward to seeing more of your entries.
- Brian
1 Like
@BrianJ Thanks! totally agree with the feedback! I am sure you can give 100 more tips if you spend 10 minutes!
I wanted to get my hands dirty so that I can start thinking more in terms of creating reports, now that I have some idea and hands-on I am really pumped for more reports!
Awesome – if you’re thinking about going back through more of the old challenges, I would highly recommend Challenge #4. They’ve all been interesting, but I found that one to be a particularly rich dataset that you could take in a lot of different directions.
– Brian
1 Like
Great first report @AntrikshSharma! 
1 Like
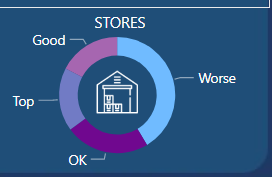
Hey Walter, im just starting out on the challenges, great viz!! how do you get the icon in the pie charts? and the little images on the header for the map for example? Cheers
1 Like
Hey @LynetteC pretty sure the icon would’ve been placed in behind the doughnut chart with the doughnut chart’s background set to Transparency 100%.
1 Like
Hi Lynette,
Find my librairy of icons attached for your perusal.
I may start with the original vector icon from the template attached. I may also slightly modify at times to make it unique. This is done using the PPT shapes and format menu (merge shape) .

I designe the vector image to my taste in Powerpoint. I then click on the image and save it to a target location in my document.

Once this is done, I insert the image to the PBIX dashboard by using the “Insert menu”. The Powerpoint design should match your overall report color scheme since you’ll save it as a picture.
Vector Icons.pptx (4.5 MB)
Regards,
Looking forward to liaising with the EDNA team soon!
4 Likes
This is perfect!! Thanks Walter 
1 Like
Hello Everyone,
It’s my first time posting on Enterprise DNA’s Forum about the Power BI challenge. I know it’s already been a long time since the Challenge took place. But I would like to share my work on this platform. I worked on this report a few months back. It was my initial days with the Power BI tool.
I would like to know the feedback and suggestion on my work. I am looking forward to working more on such challenges.
Thank you!

7 Likes
Hello Pablo_Teran1,
I was wondering if you still had the PBIX file you created for the challenge? The link is not working.
Could you load it here so that I might download it? I like what you have done here and would like to replicate some of your visuals on one of my apps.
Thank you,
Dale
Hi, your report seems to be great! Can you share de PBIX file to learn about it? Thanks!
Sorry for the late reply.
Here is the PBIX file.
Sales Report.pbix (13.4 MB)
1 Like