Boom! Thank you.  How do you make sure the film titles don’t appear in the totals area? At the moment I have turned off totals but on yours you still have the numeric ones.
@stevens ,
If you want to see a really bananas application of CONCATENATEX, check out the 15 minute mark of this video.
You can basically use it to violate the most fundamental principle of DAX – that a measure must return a scalar, not a table. Technically, it’s not a violation, but it sure looks and acts like one…
- Brian
Thanks Brian, that’s a bit out of my league at the moment! I have almost completed the task. (Although cost per critic graphic which has the same results looks way different to yours . I’m looking forward to understanding how you got there as its far better.)
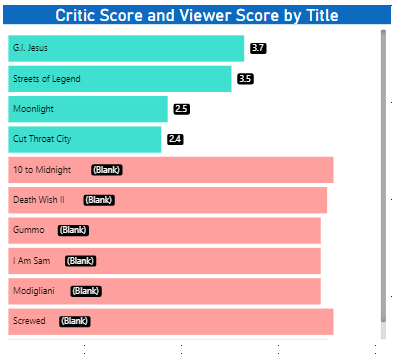
These are the calculations used for the scatter graph but when they are entered in to the axis the scatter graph produces no result. I think I have found the issue but cannot correct it. These are the calculations to get the results.
Critic Score =
VAR Critic = RANKX( ALL(Movies) , [Review Gap], ,DESC, Skip)
return
if( Critic <= 5, [Review Gap], BLANK())
Viewer Score =
VAR Viewer = RANKX( ALL(Movies) , [Review Gap Viewer], ,DESC, Skip )
return
IF( Viewer <= 5, [Review Gap Viewer], BLANK())
A table shows the results thus:
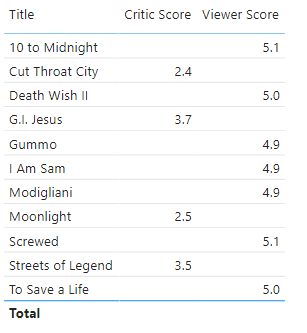
Changing the scatter graph to a different visual shows that one of the variables produces blank data when introduced to a graphic despite producing a result in table form.
Sorry to be a pain.
[spoiler]
1 Like
Hi Brian:
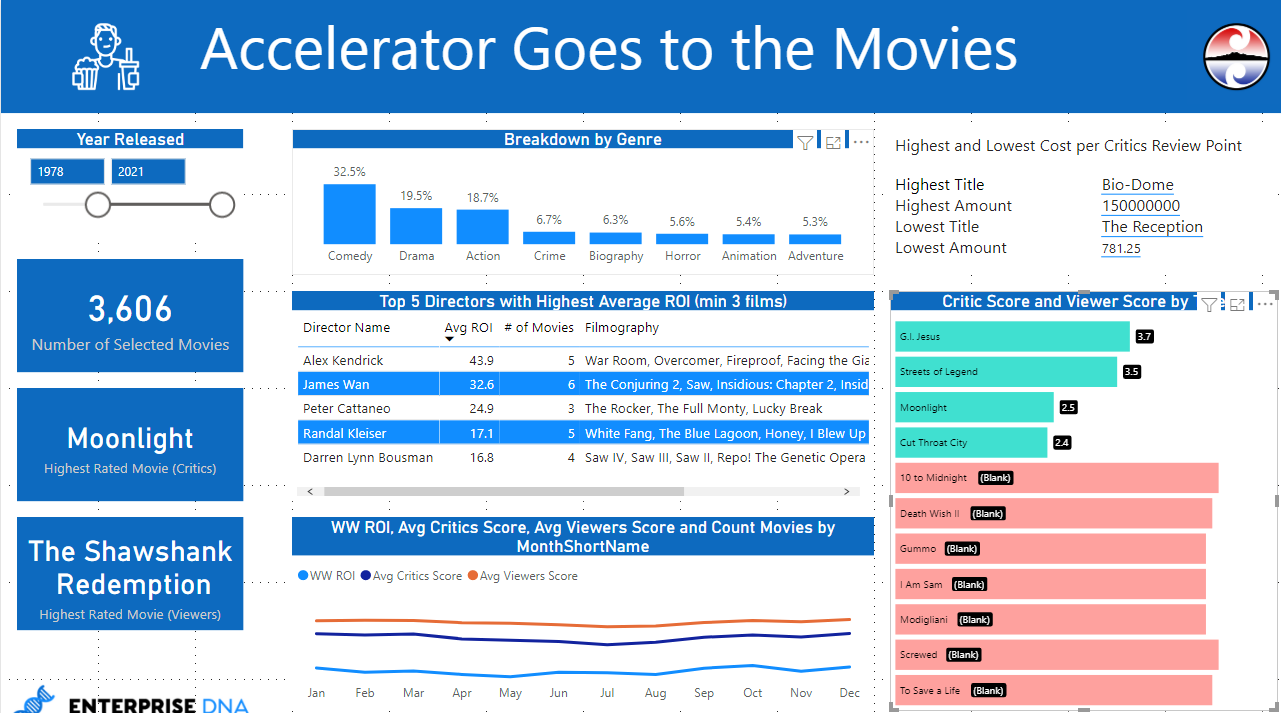
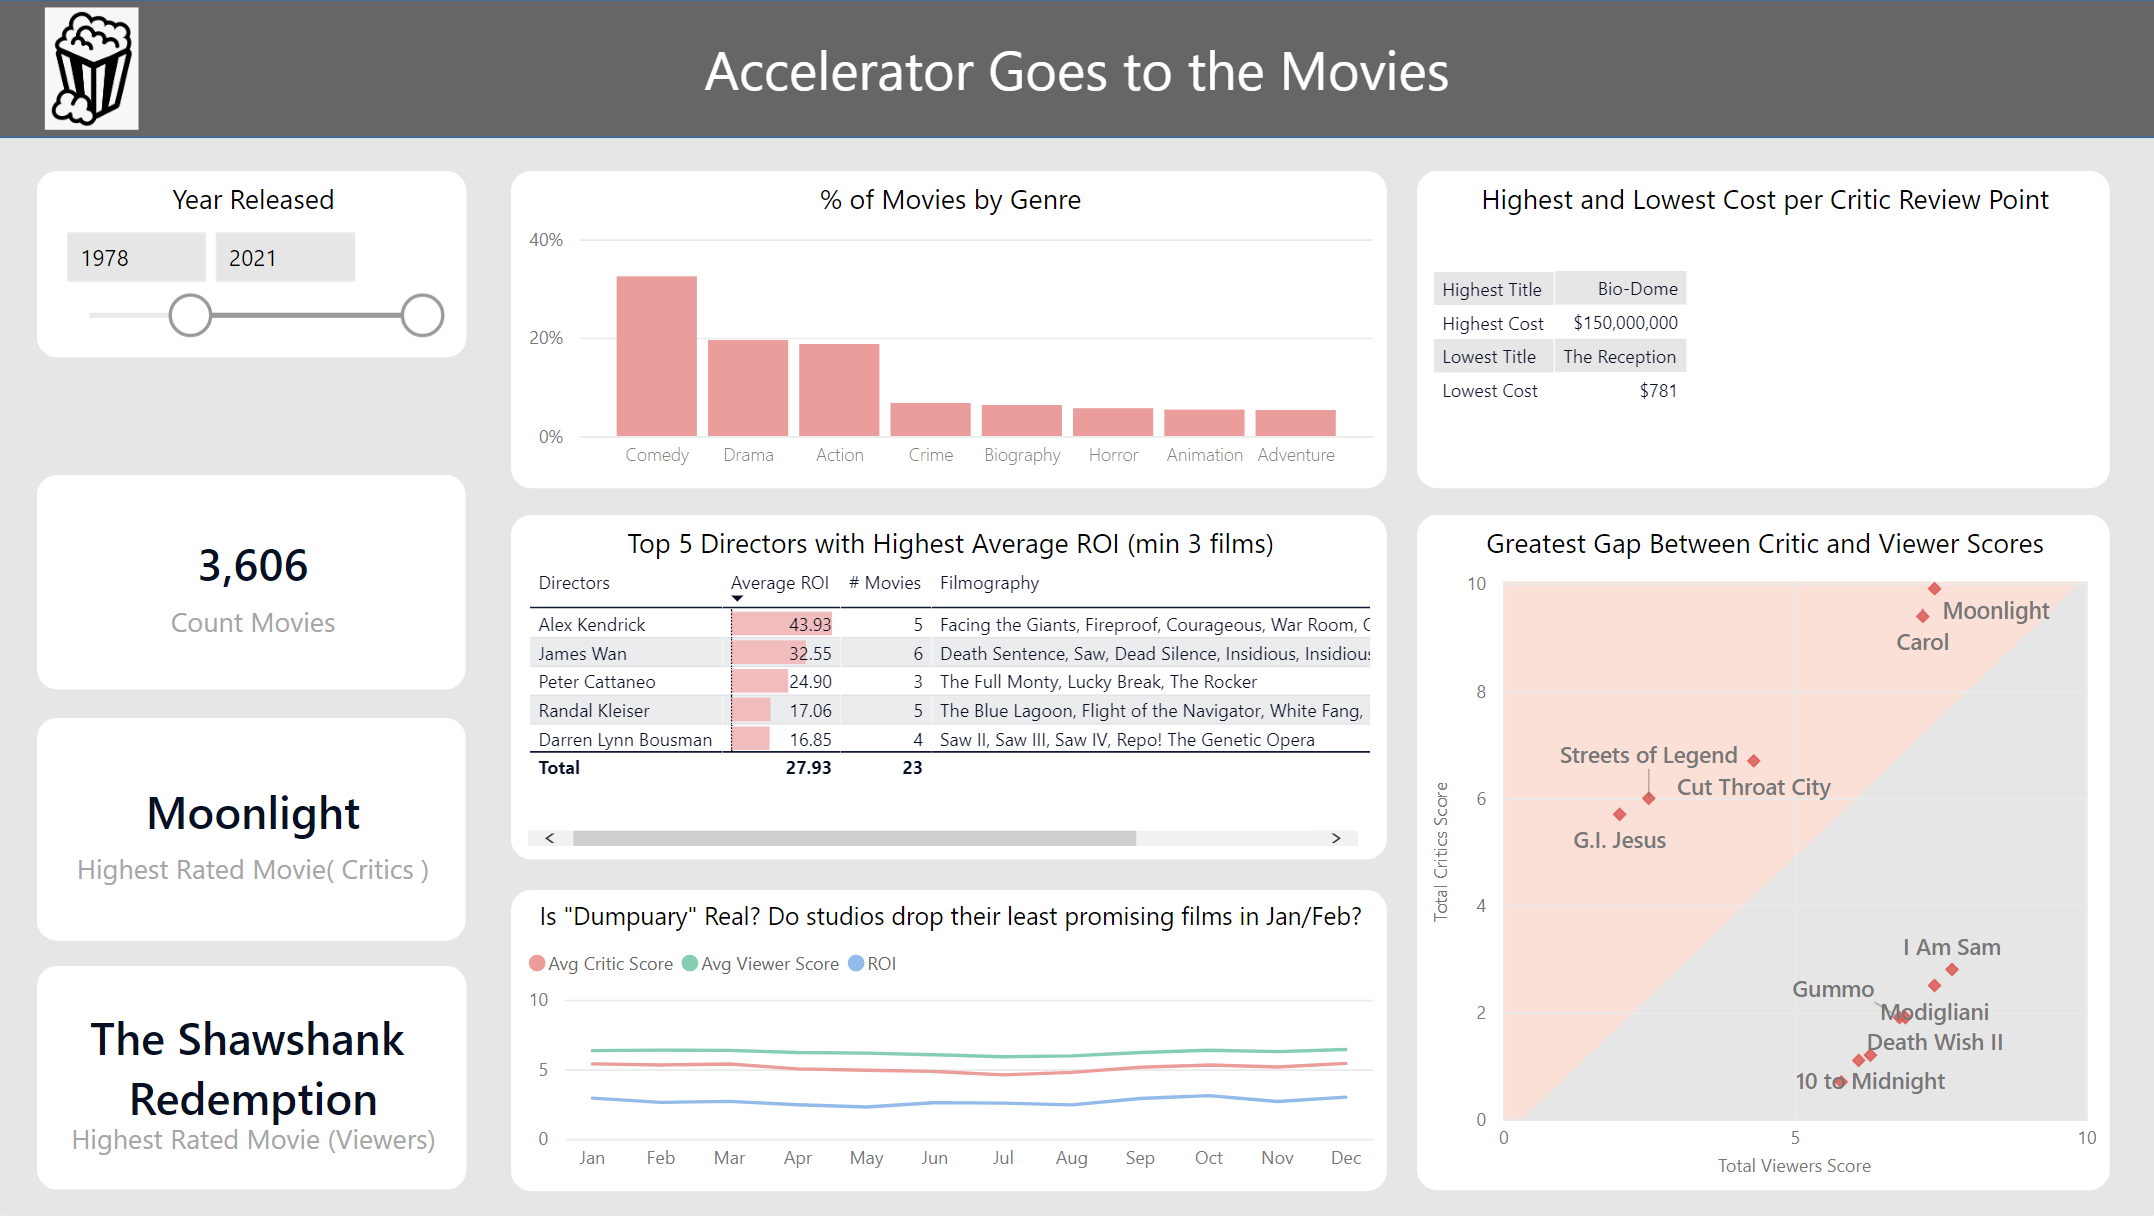
Regarding the “Breakdown by Genre”, what are we measuring here? Number of movies, worldwide gross, domestic gross?
Thanks.
John Giles
1 Like
Hi all,
Here is my solution to the Power BI Accelerator - Week #4.
Some measures were quite difficult to calculate.
For instance I had a problem with the cards, because sometimes two movies had the same rate.
I found a solution by taking the highest rated movie in the other category, but I can’t wait to see others solutions
Best regards,
Joaly
1 Like
Brian,
I can already tell this is another great Accelerator. I’m looking for a hint.
Struggling with the Top 5 Directors. I think I can get the individual measures to work but I can’t bring it all together.
Please see my pbix file attached. I have two reports with slightly different methodologies but neither satisfy the requirements.
Power BI Accelerator – Week #4 Boehnke Top 5.pbix (11.2 MB)
Thanks for all the help. I will be taking advantage of the extra week.
Thanks,
Brad B
1 Like
Hi Brian
I can’t work out how you got the four lines to appear together in the ‘Highest and Lowest Cost per Critics Review Point.’
Are they all contained in the same table?
Am I allowed a hint?
Fun one this week! Struggled most with getting the top right table in the same format, nevermind any DAX or anything!
2 Likes
Glad to hear you enjoyed this one. Looking at your solution, you nailed it. Re: the visualization wrinkles, not intentionally trying to throw curveballs - just trying to introduce some tricks you might not have encountered before. But that one seems to be leading to a lot of headscratching. 
Nice work - thanks for particpating!
- Brian
1 Like
Lot of folks seem to be wrestling with that one. It’s a switch you’ve probably scrolled past hundreds of times without knowing what it did, but it’s quite useful. Check out:
Show on Rows in the Matrix formatting options
- Brian
You’re definitely making progress. I’ve got to run to a couple of meetings, but will provide you a couple of hints this afternoon to help move you forward.
- Brian
@JBocher ,
Wow - outstanding! Absolutely love the way you solved that issue. In fact, like it a lot better than my approach, which just ended up taking the Max value of the title (alphabetical).
Folks - if you run into this problem, just resolve the ties any way you’d like - at that point you already earned full credit for that solution.
Great to have you on board - thanks for participating!
- Brian
1 Like
No pain at all. You’re making terrific progress, and really appreciate your level of engagement in this initiative. Will get back to you this aftenoon re: your Qs.
- Brian
Hi All,
Here is my submission; the challenge solution and a 2nd page “Top 5 Dashboard”
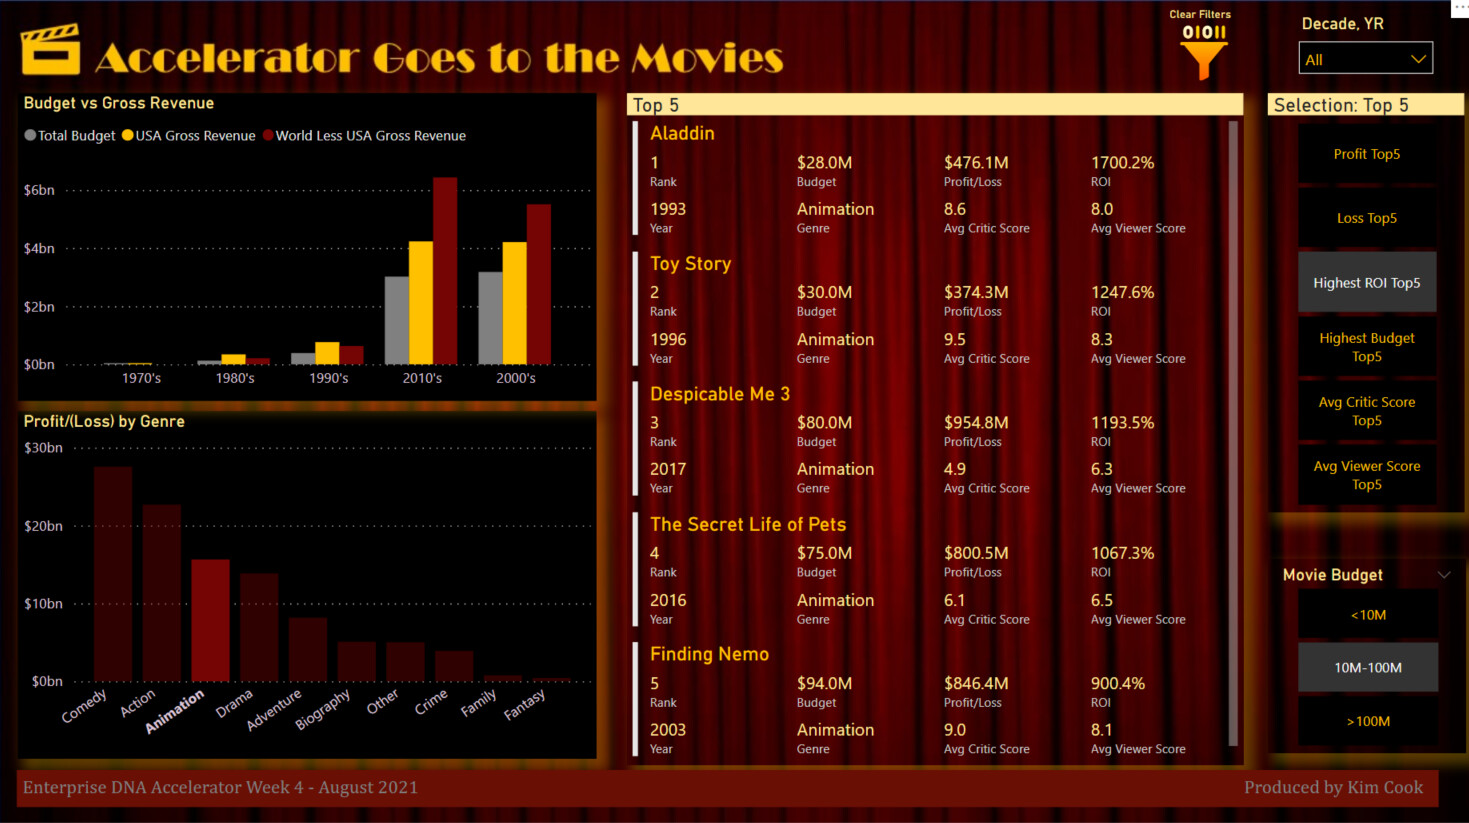
Power BI Accelerator – Week #4 Kim Cook.pbix (2.5 MB)
Thanks @BrianJ for setting a great accelerator, I particularly like working on the 2nd page and I learnt a lot.
Kim
2 Likes
Brian,
Here is my submission. Enjoyed this one. Used Bryan’s submission for hints. Not sure I fully understand his scatter chart method but I will continue to look at it.
Power BI Accelerator – Week #4 Brad Boehnke.pbix (11.4 MB)
Thanks,
Brad B
1 Like
@KimC ,
Wow - this is crazy good! Between your participation in the Challenges and in Accelerator, plus doing solutions on the forum, you are getting in a LOT of top quality reps and it really shows. This second page is extremely interesting analytically and the design and techniques used (particularly the SWITCH(TRUE) measure controller) are terrific. You seem to be making progress in huge chunks at a time.
Fantastic job! Keep up the great work.
- Brian
Thank you Brian  it has been a lot of hard work. Pushing myself to do the challenges and accelerator is making a huge difference.
Hi there,
This ‘week accelerator’ was another excellent one and the extra week provided was not too much, even of great help.
Some measurements were difficult but very instructive and below are some personal notes.
What I was not able to achieve
- Highlight “Jan” and “Feb” months in the “Is ‘Dumpary’ Real? (do studios drop their least promising films in Jan/Feb?)” visual.
- Add the title of the movie in the “Largest +/- Discrepancies between Viewers and Critics” visual
What measures was hard for me to determine
- The measure I used to filter the “Top 5 Directors”. I took me about 10 hours to get the correct result just because the use of ALL function instead of ALLSELECTED
What measure I did not understand
- I did not understand the 'Total WW ROI’ measure but I used the [ROI] measure and got similar result with the one shown in the Mockup
What technic I used for the first time
- Even if I viewed many videos on the subject, this is the first time i use a support table with switch measure to build the “Highest and Lowest Cost per Critics Review Point”
What comment did tilt
- The scenario provided many insights and guidance to solve the problem but the one but the one that was the most revealing is the one about using Rank to filter the “Largest +/- Discrepancies between Viewers and Critics” visual.
Other eDAN resource I used
- I used @sam.mckay post (Product Name as Measure for Highest Sales Product - #2 by sam.mckay) to create the Highest Rate measures.
One thing I really appreciated
- I really appreciated that, in the list of resources that you provided to solve the problem, you pointed to a resource that is not an eDNA one.
Thank you for the effort made by everyone to make this Accelerator so successful and awesome.
PS: @KimC : the extra page you added is very interesting. Thank you for sharing.
Please find bellow my solution.
Power BI Accelerator – Week #4 Final Exercise - MehdiH.pbix (11.1 MB)
Thank you for these accelerator problems. The hands-on application of what I have seen in so many videos is beneficial. My submission is below.
This was more challenging than I initially thought it would be. It was an effective exercise at exploring the nuances of DAX and iterators. I did struggle to understand how to take a ranking and then apply it to the next step. Even for the card. I knew how to rank the movies, but then you just get a ranking on the card. Now, you have to calculate the title based on that ranking measure.
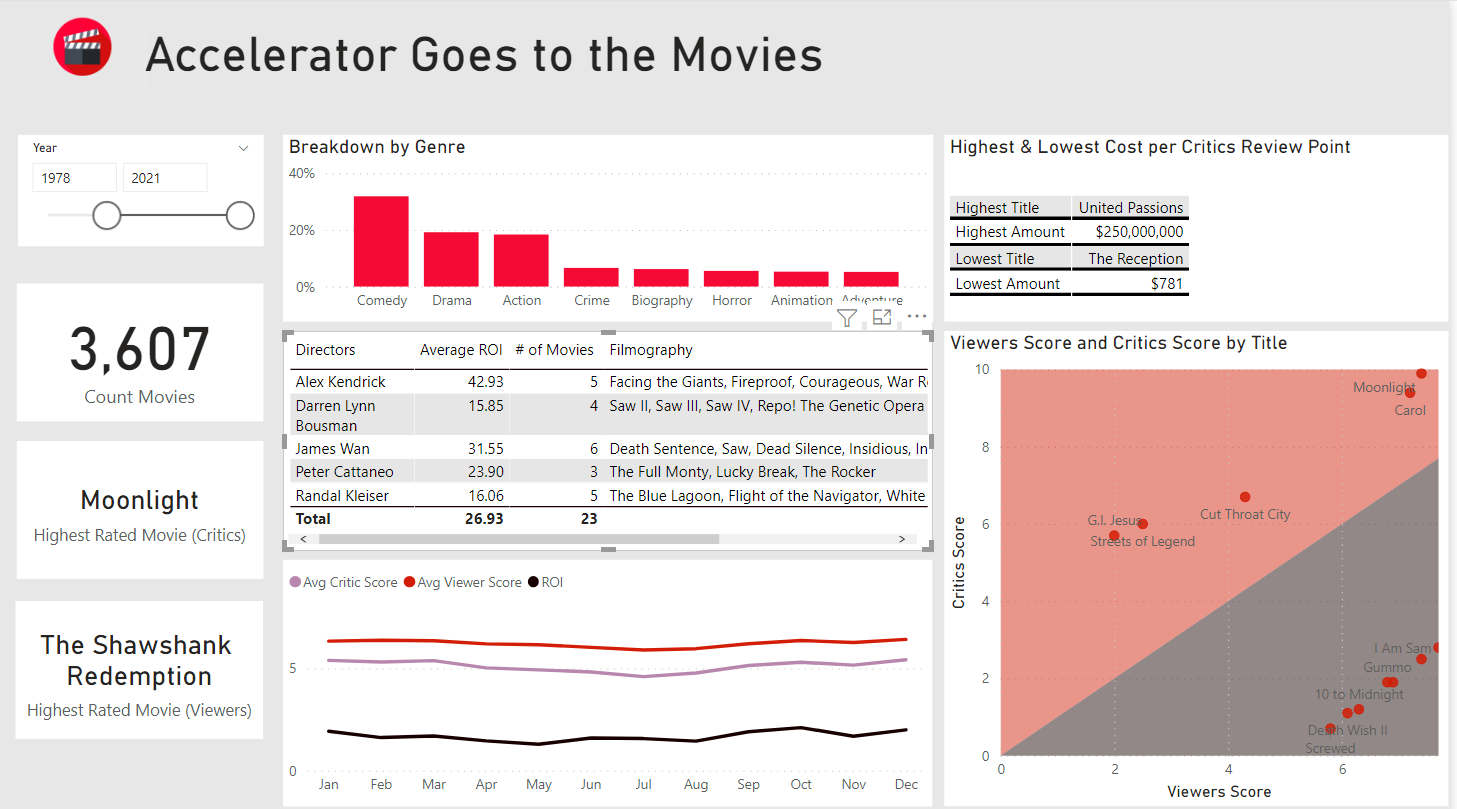
I also did not understand how to create the multi-colored grid on the scatter plot. I found a way to do it by creating an image using PowerPoint and then loading into the Plot Area. Others haven’t done that, so I’ll be interested to see how that was done
Thanks, Brian and eDNA team for this exercise.
Mark
2 Likes