Power BI Accelerator Week #2 Is Live!

All,

Before getting into the week #2 problem, I wanted to sincerely thank everyone who participated in week #1. The response was tremendous – one of our most popular posts of the year, with lots of participants from all around the world. I was particularly pleased by the way each person adapted their solution to meet their individual training needs. Some executed the problem verbatim, whereas others added elements or chose approaches with a higher degree of difficulty. We have built that individualized flexibility into the problem for this week.

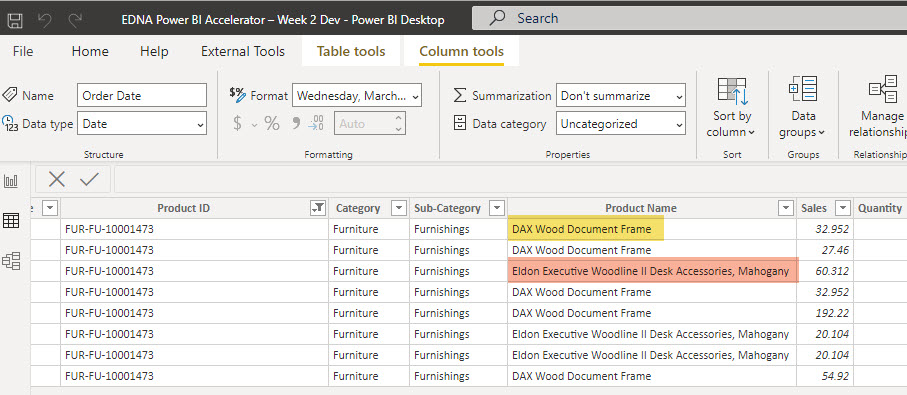
So, speaking of which… this week’s problem deals with a very common real-world scenario in which the client is seeking a detailed analysis, but provides the data associated with that analysis in the form of a single large flat file. Thus, you are required to transform that flat file into a Star Schema dimensional data model before performing any analysis. The attached PBIX file contains all the information you need, including the detailed brief explaining the problem and desired outcome in more detail, as well as providing a list of recommended Enterprise DNA blogs and videos if you need to brush up on any of the skills required to complete this week’s problem. Because you will be doing much of your work this week transforming the original file in Power Query, I have also provided the underlying CSV data file.

We will be conducting the live solution session for this problem on Wednesday, July 21 at 5pm EDT. Registration info to follow soon. Also, you can still click here to register for the live solution session for the Week #1 problem later today. I will be posting my Week #1 solution afterwards, along with a link to a recording of that session.

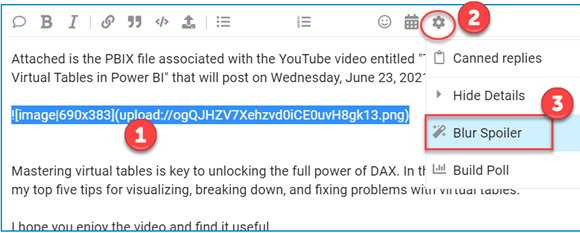
If you have any questions, feel free to post them on the forum. Also, you are encouraged to post your solutions to the forum so that we can learn from each other, but if you do please use the spoiler alert or summary option to prevent folks still working on the problem from seeing information they would prefer not to.

image

Good luck with this week’s problem and enjoy. Thanks for participating!

  • Brian

P.S. Here are instructions for two tasks that you will need to be able to perform to complete this week’s problem.

Setting the Path of the Source File in Power Query:

  1. Download the attached PBIX and CSV files
  2. Open the PBIX file and go to Power Query by clicking Transform Data
  3. You should see something that looks like this with a yellow error indicator next to Client Flat File:

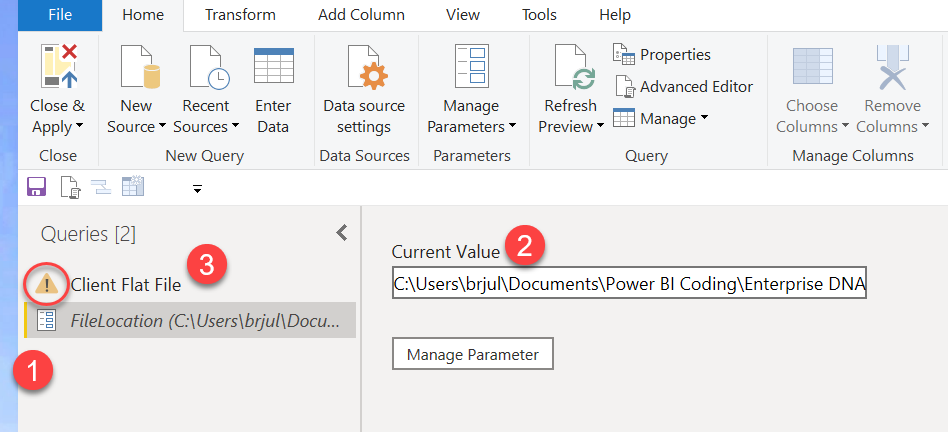
  1. Click on the File Location parameter
  2. Then click on Current Value, and enter the full path (no quotes) where you downloaded the CSV file in step #1.

For example, my full path is:

C:\Users\brjul\Documents\Power BI Coding\Enterprise DNA Files\Power BI Accelerator\Week 2\Final Client Flat File.csv

Once you enter you path correctly in the Current Value box, the error indicator next to Client Flat File should disappear, and when you click on that table, you should be able to proceed with the problem in Power Query.

Embedding a Screen Shot of Your Final Data Model

  1. When you have completed the data modeling portion of the exercise, hit “Close and Apply” in Power Query and go the data model screen in Power BI (click on the icon below)
    image

  2. Take a screenshot of your data model and save the screenshot to your desktop.

  3. In Power BI, go to the Solution page of this week’s PBIX file and select Insert and the Image from the menu.

  4. Select the screenshot you saved to the desktop in Step #2 above.

EDNA Power BI Accelerator – Week 2 Problem Final.pbix (10.5 MB)
Final Client Flat File.csv (1.6 MB)

4 Likes

All,

I would argue that the most important skill for any Power BI user to develop is the ability to build a solid Data Model. If your data model is sound and optimized for Power BI, it will dramatically simplify the DAX needed and speed your report performance. Conversely, with an improperly developed data model, even the most knowlegeable DAX expert may be unable to generate accurate results.

This is why we are focusing primarily on data model development in Week #2 of Power BI Accelerator. Even if you didn’t participate in Week #1, you can jump directly into Week #2.

A sound data model will have a quality Date Table, at least one Fact table(s) and a well-organized set of Lookup tables, connected properly to the Fact table via the appropriate relationships.

Unfortunately, in the Week #2 scenario all we have is one large flat file. So, you will need to create & provide a Data Model that reflects all these elements. This data model will be used in later weeks of PBI Accelerator to develop a meaningful Power BI Report.

Coincidentally, @sam.mckay is running an event later today focused on data modeling best practices that will serve as wonderful background for this exercise. Here’s the link for registration:
https://enterprisedna.co/data-model-development-best-practices-in-power-bi-july-2021-registration/

  • Brian
1 Like

Hello,

Here is my attempt at this challenge.

Eager to get some feedback :slight_smile:

3 Likes

@jps ,

Exceptional entry right out of the gate. Really nicely done both in terms of your data model and descriptive measures. This data model is now very well set up to support a wide range of powerful analyses in Power BI. :clap: :clap:

One thing worth noting - data modeling is roughly 75% science, 25% art. There are a lot of objectively wrong ways to model a given dataset, but there is often no one objectively “right” answer. The way you’ve chosen to do it is completely sound, but has some distinct pros and cons relative to other variations that we will discuss in the solution event.

Note: I’m referring here to your decision to snowflake location and customer tables.

There’s also some tweaking that can be done here to improve performance in Power Query, but that’s quite minor.

Overall, outstanding job. Thanks very much for participating!

– Brian

3 Likes

Thank you for your feedback there,

Yes, It would be interesting to have a comparison to other variations of the data model.

Thank you for a great challenge exercise. Looking forward to the next challenge already.

3 Likes

Hello,

Quick question as I work on my solution.

I’m developing a product dimension table, but there are inconsistencies in the data. How realistic!

There are Products with the same ID that have different Product Names. The image below is from the Client Flat File. Normally, I would consult a stakeholder to clarify the data.

Let me know if I’m missing something. This is another great Accelerator!

Thanks,
Brad B

1 Like

@bboehnke ,

bonus points

Thanks - great question! In checking after reading your post, that duplication occurs in 32 of the 1,800 distinct products. I have no idea how you found that, but well done, sir!

I unspoilered your post so everyone can see the issue you identified. I would advise when you create your Products dimension table, right clicking on Product ID only and selecting “Remove Duplicates”. Because it is only looking at the Product ID field and not Product ID and Product Name, it will remove the second product name for those 32 products, leaving you with a unique Product ID / Product Name combo as originally intended.

Carry on… :grinning:

  • Brian
1 Like

Hi,

Not sure if I’m missing something

Each customer has multiple addresses, so not sure how I can make this a dimension table?

@jamie.bryan ,

That’s not a surprising construct – think about your Amazon account, where you probably have multiple shipping addresses (home, work, addresses you ship gifts to, etc.). This is where data modeling crosses somewhat from science to art. You now have a bunch of options and choices to make about how to model this – each with pros and cons. Some questions to ask yourself:

  • Does this information need to reside in the same dimension table?
  • What are the implications if these entities (Customers and Locations) reside in separate tables (e.g., how will it affect syncing slicers, and is that important?)
  • If they reside in separate tables, what will be the relationship between them (if any) and what will be the relationship between each of them and the fact table?
  • If they reside in the same table, what would be the unique key field?

There’s no one right or wrong answer here. I think the key is just to be cognizant of the issues and trade-offs and make your model flexible enough to be revised if needed as the analyses you want to do becomes clearer. As long as you exercise best practices, it’s relatively easy to change your mind on some of these questions even in midstream – done properly, you’re not stuck with your initial model forever.

These sorts of issues are what make data modeling really interesting, I think and we will discuss them at length in the solution event.

– Brian

@BrianJ

That makes sense, thank you! In the end I decided to split them out and do a seperate region table. I’m not familiar with American postal codes, but I noticed San Diego and Encinitas have the same on some of the lines. From a bit of a Google it should be Encinitas I think? I removed duplicates on that column in the end so it didn’t cause a many-to-many relationship.

Here’s my submission, thanks for these they’re very helpful!

2 Likes

Hi guys,

This is my take on Power BI Accelerator Week 2.

Thanks and I hope all is OK.

FP1967

4 Likes

@FPastor ,

Thanks very much for participating! Your definitely on the right track here, but a few issues/questions to consider:

  1. You have not included the Extended Date Table (or any date table) – that is going to be essential for any time intelligence analysis
  2. You may want to re-examine the way you’ve divided Product and Product Subcategory into separate dimensions.
  3. Are there any other elements in your fact table that would lend themselves to being pulled into a separate dimension table for filtering purposes?
  4. The choice you’ve made in the structure of your Customer and Location dimensions is not wrong in any way, but there are pros and cons associated with the different ways those dimensions can be structured. I would encourage you to take a look at my response to Jamie Bryan above (you’ll have to click to unblur the spoiler guard) for a discussion of balancing the pros and cons of the different approaches.

We will be covering all these issues in the next live session.

– Brian

1 Like

Hello.

My Week 2 Accelerator submission is below. This one still has me thinking.

I did several versions of my data model. I went with a version that has shipment data as a dimension table. Not sure I like that. Other options were to 1) leave the shipment data in with the sales data or 2) treat it as a separate fact table. Can’t wait to hear the discussion around the solution.

EDNA Power BI Accelerator – Week 2 bboehnke Opt1.pbix (10.7 MB)

Question, is there anything wrong with setting up a relationship between fact tables in PBI? During my training, I don’t remember seeing any examples with a relationship between different fact tables.

Finally, you asked how I found the duplicates. The excel file attached is how I reviewed the data and modeled my attribute tables. I use the pivot tables to summarize the data as a check.

Final Client Flat File Dev.xlsx (2.1 MB)

This was another great Accelerator! Unfortunately, I’m traveling next week so I will not be able to participate in the solution session.

On to Accelerator #3!

Thanks,
Brad B

1 Like

@bboehnke ,

Outstanding! I can see that you are asking yourself exactly the right questions as you work through your data modeling options. As you have rightly indicated, while we often talk about the distinctions between dimension tables versus fact tables as a clear-cut black-and-white choice, in reality sometimes that’s a more difficult decision to make. In the solution session I will provide some of the questions I typically ask myself when wrestling with that same issue.

The true goal of this exercise is hopefully to begin to get everyone thinking in that data modeling mindset, asking themselves the right questions, and understanding the trade-offs between alternatives when there are multiple options available.

With regard to your question about relationships between fact tables - I am hesitant say to anything is a 100% absolute, but this is about as close to that as you can get. DON’T create direct relations between your fact tables. This is one of the clearest violations of the star schema model, and can lead to ambiguous paths that can completely sink the accuracy of your report results, even if your DAX is correct.

If you are tempted to link two fact tables together, that may be an indication that there’s an opportunity to merge those two tables together into a single fact table. In some cases, such as budgeted amounts versus actual expenditures, you might be tempted to link these two together, but there are other, better ways of handling this that are beyond the scope of this initial accelerator lesson, but that we can discuss separately if you are running into that issue.

Terrific job on your entry – really like the thought process you are going through here.

  • Brian

All,

Terrific discussions on going around this week’s Accelerator problem.

I’ve decided to push the solution session for Week back a week to 5pm EDT on Wednesday, July 21st (originally scheduled for the same time on the 14th).

This is partially due to wanting to provide some extra time for people who are participating in both the Data Challenge 14 ongoing at the same time, and also to maximize the number of people who have the opportunity to participate in this week’s Accelerator.

I would say this is probably the most important week of the series, because getting your data model correct is fundamental to everything else that happens afterwards. A good data model will make your DAX and visualization much, much easier, while a bad data model will sink you right from the outset, even if your DAX and visualization skills are top-flight.

I will provide the link for registration for the solution session on Monday.

Keep up the great work – I’m loving what I’m seeing so far…

– Brian

1 Like

Ok, here is my submission. It’s really my first for any challenge or weekly problem set. I think I’m on a good track, but I’m sure there are issues in the data set that I didn’t consider.

I didn’t choose to break out the locations since customers have many shipping locations and I didn’t see a good way to create a proper relationship. Best to leave the shipping location at the order level, in my view.

2 Likes

@mhough ,

Welcome to the forum – great to have you here, and awesome that your first post is participation in this initiative!

You absolutely are on a good track here – really well done entry, and I very much like what you did with your measures.

You have correctly identified that shipping location is the problem child in this group. In the solution session, we will talk about a number of different approaches for handling that dimension, and the pros, cons and trade-offs associated with those alternatives.

Thanks for participating!

– Brian

1 Like

Here goes. This was a great problem to solve.

Noticed the discussion regarding shipping locations. I used the postcode as the key identifier as there was no street address and a postcode usually covers a specific area. Is this logic incorrect?

There are a number of orders where the ship date precedes the order date. Shipping on consignment?

EDNA Power BI Accelerator – Week 2 Problem Final.pbix (13.6 MB)

2 Likes

Hi there, Sorry I’m late uploading the file.

I did a little something different with the date table by automating the process, If at any time the fact file changes the date table will automatically find the first transaction date in data and last date in the data. The Date Table will automatically update to first day of the Calendar year and last calendar day for the following year.
Example
First date in data Mar 1, 2012, Date Table will be Jan 1, 2012
Last date in data is Oct 28, 2014, Date Table will automatically be December 31, 2015

Any suggestions will be appreciated.

I’m looking forward to July 21 live solutions.
thanks
Keith

2 Likes

Hi eDNA Members and Staff,

First of all thank you for this opportunity to develop our skills and please find below my submission for this 2nd week of the PBI Accelerator.

Here are some comments about the work I have done.
When creating the dimensions tables especially the “Products” table, the “Customers” table and the “Locations” table, I first investigated the data to checked if there are only unique values or some multiple values.

  • Customers table
    The couple (Customer ID , Customer Name) did not revealed any multiple values.

  • Locations table
    One Postal Code “92024” have two different cities “Encinitas” and “San Diego”. After checking on “Postal Codes United States (geonames.org)”, I replaced “San Diego” by “Encinitas” where Postal Code = “92024”
    Some Postal Codes were not matching the correct cities so I made adjustments but I did not went through each Postal Code.

  • Products table
    As mentioned before, 32 Products ID have two Product Names. I adjusted the Product ID of each one of the two Product Name that have the same Product ID by adding a suffix to the Product ID.

I made the adjustments in the “Client Flat File” query and I left the queries I used to check for multiples

For the “Date Table” I used “Melissa de Korte” script provided on eDNA Extended Date Table (Power Query M function)

I also applied these steps

  • Marking the Dates table as Date Table
  • Defining the Summarizing By to None for all columns
  • Categorizing the columns of the Location tables
  • Sorting by Column
  • Hiding columns used for sorting other columns
  • Creating some basic measures.

EDNA Power BI Accelerator – Week 2 Problem Final - MehdiH.pbix (10.6 MB)

Any comments will be appreciated.

Best Regards
Mehdi HAMMADI

3 Likes