Ah … the old copy and paste problem on Top 5 Products :-). I did a top 5 by value and qty but forget to change one of the measures!
Re Sales by State… yes, the bar chart is a more appropriate choice. Also removes clutter because the min and max lines aren’t needed.
Lastly Top N- yes I could have done it a simpler way but I wanted top 5 by qty and value and feel I need to get so familiar with TopN measures that I don’t need to think about them., but believe me, I do have to think each time, because I leave it too long between writing measures - which is why exercises like these are soooooooooo useful!
Thanks very much for diving in and participating! However, your upload for some reason didn’t come through. If you could try again, that will be great – would love to look at what you’ve posted. I find it works best when I’m editing my post just to drag and drop the file in from Explorer.
Welcome to the forum, and welcome to Power BI Accelerator! Awesome that your first post to the forum is participation in this initiative.
Your submission looks great. Just one thing to go back and revisit:
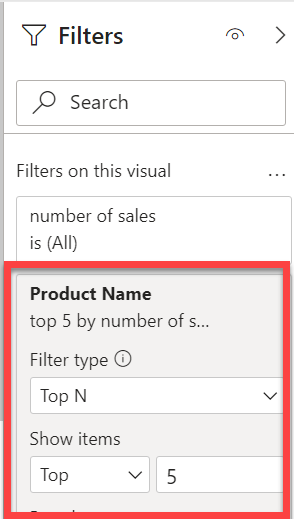
For the top five product matrix, that one is based on number of sales, not dollar value of sales. You may want to take a look back at the brief and revise that if you’re so inclined.
And absolutely no one should feel bad about “just” meeting the goals of the brief and the mockup. That’s the primary goal here, but the additional flexibility is there given that we have folks at a pretty wide range of skill levels, so to get the maximum value out of the exercise, some folks need to raise their own bar a bit higher. While it’s always great to learn from each other, there is NO competitive aspect to this initiative, other than challenging yourself to get better each week.
For future exercises, we are going to try to build in some of that flexibility right into the brief. So everybody, keep doing what you’re doing – I think we’re onto something good here…
Outstanding submission. I particularly like how you explicitly calculated the high and low sales values.
You definitely took the harder path here. (Click on “Summary” below for more details).
Summary
I was not expecting folks at this point to use DAX RANKX or TOPN to find the top 10 salespeople by total sales or the top five products by number of sales. At this point in the training, I was just expecting people to use the Top N filter type in the filter pane
Also, absolutely nothing wrong with referring to other resources when you create your submissions. In the “real world”, I almost always refer to prior reports, The Definitive Guide to DAX, snippets I’ve stored in Analyst Hub, and other resources when developing a report.
Thanks to everyone who joined for the Power BI Accelerator Week #1 live session today. If you weren’t able to join, but are still interested in viewing the session we will have a recording posted in the portal hopefully later this evening, along with @sam.mckay 's and my solution PBIX files, and the PowerPoint presentation from today – I will let you know when all that is available.
I think we got to all the questions except for one from @Keith. We were talking about the overlap in DAX functions and the need to only learn a subset. Keith asked which time intelligence functions we thought were important/useful to learn. For me, here are pretty much the only ones I use with any regularity – from these, I think you can easily build out all the functionality you need for almost any scenario:
DATE, DAY, MONTH, YEAR, TODAY
DATEADD, EOMONTH
Fields in the Extended Date Table, particularly the offsets and ISAFTERTODAY
The online DAX guide lists 37 separate time intelligence functions. Personally, the seven above combined with extended date table and CALCULATE/FILTER give me everything I need, and in truth I could live without EOMONTH and build that logic from scratch in a variable, but that one’s a nice luxury.
The Enterprise DNA team has created a nice section on the Portal (enterprisedna.co) for the Power BI Accelerator initiative. There, you can find all of the Week #1 files, including:
the recorded video from the live solution session that we did today
the slide deck presented during that solution session
Thanks very much to everyone who participated. We hope you enjoyed it while at the same time elevating your Power BI knowledge and skills.
As always, we’d love to hear your feedback, which you can either post in the forum on this thread, or email directly to me at brian.julius@enterprisedna.co.
Great to see your going back through some of the past Accelerator sessions. Can you please provide a screenshot (or your PBIX) of the chart you’re having trouble sorting?
Thank you so much @BrianJ for your response. I really appreciate quick reply
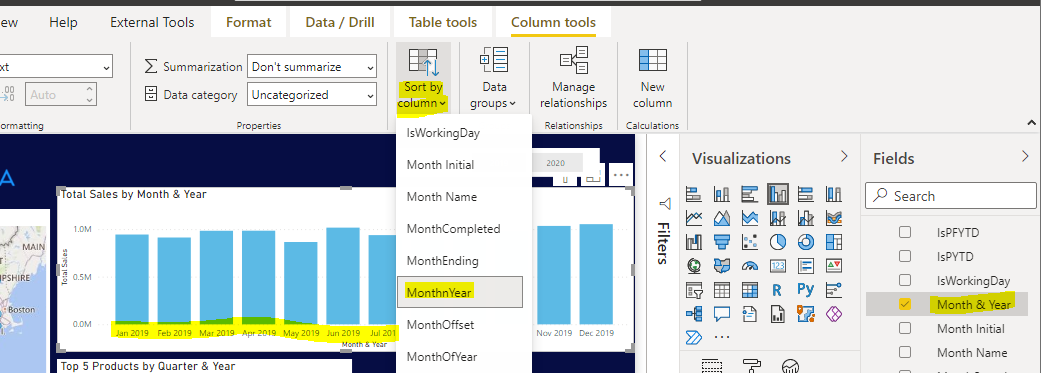
However, on further trying out and following below steps I was able to sort the Month & Year column:
Used [Month & Year] column on x axis in the chart.
Selected [Month & Year] column and then on the ribbon at top, selected SortBy–>[MonthnYear].
Coming back on the chart and clicking the 3 dots on top right corner of the chart → SortBy → [Month & Year]
This helped me in sorting my x axis. I have attached screenshot and also my .pbix file. Could you please confirm if that my approach is correct or not.