Hello,
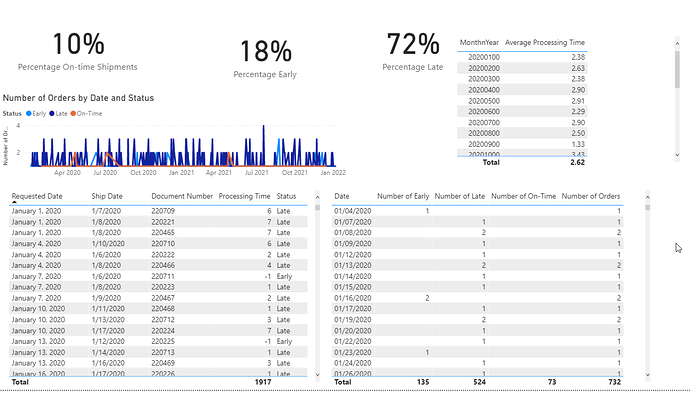
I’m trying to put together a report on on-time delivery.
I have some order numbers, products, quantities, and sales.
I then have a document date, a requested delivery date and a actual delivery date.
I’m trying to run a report to see.
///number of days +/- per document number
Processing Time = DATEDIFF(SELECTEDVALUE(‘Transaction Data’[Requested Date]),SELECTEDVALUE(‘Transaction Data’[Ship Date]),DAY)
///field to show early, on-time or late
Status = SWITCH(TRUE(),[Processing Time]<0,“Early”,[Processing Time]=0,“On-Time”,[Processing Time]>0,“Late”)
///a calculation to count number of days early per day
/// a calculation to count number of days on-time per day
/// a calculation to count number of days late per day
/// a calculation to count the number of documents per day
Failed on these…
Here’s one example
Number of Early = COUNTX(‘Key Measures’,[Status]=“Early”)
I assume they would all be the same mostly
Then I’m running into difficulty because I want to be able to show a line chart
axis: date and number of days
Values: (1) number of days early, (2) number of days on-time, (3) number of days late
The other area I am running into is calculating and average number of days per given period
and most importantly, I am trying to calculate the percentage of Deliveries that are Early or On-time, compared to all orders.
Not sure how to calculate these few things. I’ve been researching all day, but can’t seem to find answers to these questions.
I’ve attached my query if anyone has suggestions or links to articles, videos, showcases, etc that cover this topic, that would be awesome.
On-time Deliveries.pbix (149.0 KB)
