Need help with complex ranking/cumulative scenario

Hi forum,

I need your help with a complex scenario that i cannot solve.

For each YearWeek and ProductCategory I want to calculate the sum of nett only for the X % (this is based on a what-if parameter) of nett based on price in ascending order.

enterprisedna_13112019

The solution probably has to deal with a cumulative pattern and a TOPN/RANKX that resets for each YearWeek and ProductCategory.

Also worth noting is that prices differ every day, therefore I included the OrderLine_IDs

Your help is much appreciated. Do not hesitate to ask for more information if required!

Likely going to need to see a demo model to assist here.

Have you check out this tutorial here. It runs through a somewhat similar example I believe

Here is the actually forum post it was derived from

Thanks
Sam

Hi, @sam.mckay

I included some sample data via wetransfer: https://we.tl/t-YAtdwRFiM4

Would you be able to reproduce the scenario? I have changed the title of “Nett” to Volume.

@Luukv93,

I took a shot at this one. Sorted the data in Power Query first. Here’s the key measure I used for grouping the total volumes by week and category:

Total Volume by Week and Category =

SUMX( 
    ALLEXCEPT(
        Data, 
        Data[YEAR_WEEK],
        Data[PRODUCT_CATEGORY]
    ),
    [Total Volume]
)

Then just created a second measure which is the product of the measure above and the what-if parameter value harvested from the slicer.

If I’ve understood your scenario correctly, I think this get you what you’re looking for but let me know if it doesn’t. Full solution file posted below.

@BrianJ
Exactly what I was looking for. What exactly did you do in Power Query?

Now I would also like to calculate the weighted price of the percent of total volume (in ascending order of price)
In the attachment the weighted price would be calculated as:

(4.62 * 922) + (4.76 * 4200) + (4.76 * 6600) + (4.84 * 13592,22) = 121453,985

121453,985 / 25314,22 = 4,798

Would be amazing if you would know a way!!

Capture|690x162

@BrianJ

Hi Brian,
Thanks for explanation.

As I stated above :

Now I would also like to calculate the weighted price of the percent of total volume (in ascending order of price)
In the attachment the weighted price would be calculated as:

(4.62 * 922) + (4.76 * 4200) + (4.76 * 6600) + (4.84 * 13592,22) = 121453,985

121453,985 / 25314,22 = 4,798

Using the above example when I select 20 % of volume I want to calculate the weighted price of the 20 % volume that has the lowest price. So in week 2019-43 CAT_1 ; 20 % of the volume with lowest price is 25314,22. Now I weigh prices with volumes up to 25314,22: (4.62 * 922) + (4.76 * 4200) + (4.76 * 6600) + (4.84 * 13592,22) = 121453,985. Finally I divide 121453,985 by 25314,22 making a weighted average price of 4,798 for CAT_1 in week 2019-43.

Hope this clarifies the issue

@Luukv93,

In taking another look at the weighted average price solution I provided above this afternoon, I don’t think it exactly meets your requirement. What I did was calculate total revenue by week and category, applied the slicer value, and divided that by the total volume by week and category, which will produce different results than the weighted-average price of the top N% as selected by the slicer.

I’ve withdrawn the earlier post, and will rework and repost the solution shortly…

  • Brian

@BrianJ thanks Brian

@Luukv93,

Sorry for the delay. Still working this one, but it is proving surprisingly recalcitrant. Headed down a couple of dead-end roads tonight, but now think I have a good path to a solution. Hope to have it done and posted tomorrow night.

  • Brian

@BrianJ Hi Brian, to me it seemed like impossible so i’m excited hearing from you

@Luukv93,

OK, this one took me a little while, but I think I cracked it. Buckle in - LONG post ahead while I try to explain what I did.

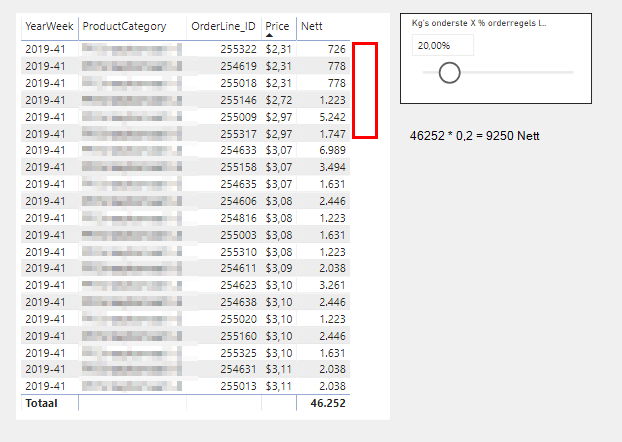
Here’s the solution table I’ll refer to in my explanation (full solution file posted at the bottom of this post):

Step 0: Power Query processing

  • Sort Data table by YEAR_WEEK, Product Category, Order ID and Price - all ascending
  • Add an index column, starting at 1 (this is perhaps the most critical step in the whole solution. For the calculations to work, you need to be able to filter and sum across specific row subsets. Usually this is done via a date field and date table, which we don’t have available here. But we can do the necessary cumulative totals and create the positional awareness using the index column instead)
  • After doing this, create a calculated column for revenue equal to price times volume.
    The Data table is now sufficiently prepped.

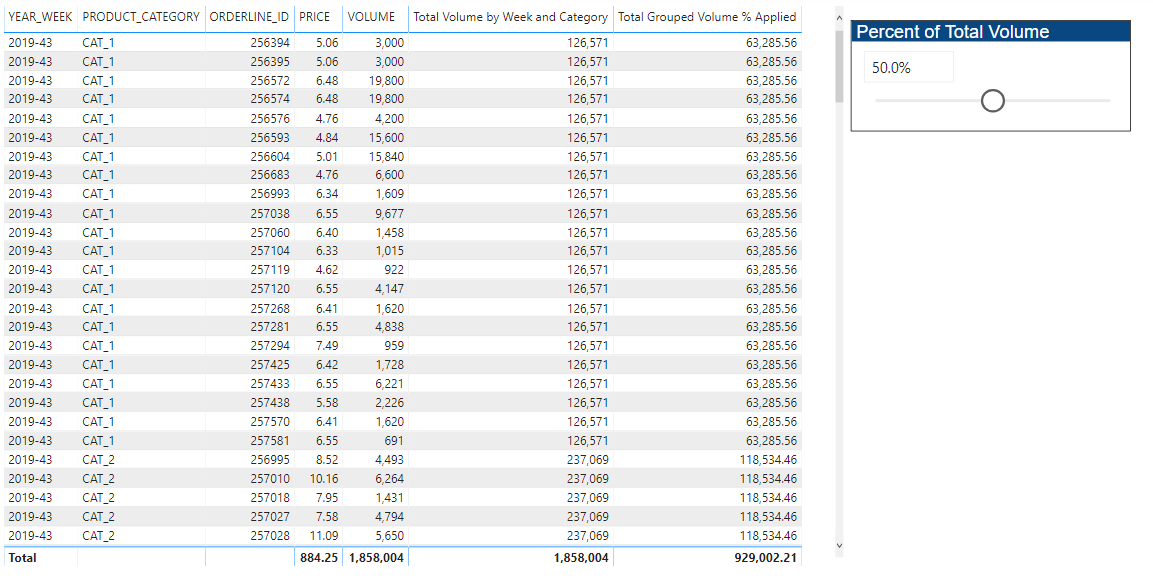
Measure 1: Total Grouped Volume % Applied
This is the measure we created above - sum of volume by year/week and product category multiplied by slicer percentage

Measure 2:
Cumulative Volume Grouped =

CALCULATE(
    [Total Volume],
	FILTER(
        ALLEXCEPT(
        Data,
        Data[YEAR_WEEK],
        Data[PRODUCT_CATEGORY]
        ),
		Data[Index] <= MAX( Data[Index] ) 
    )
)

This is the standard cumulative total pattern, just resetting for every change in year/week and product category.

Now IMO the trickiest part of this whole solution is trying to characterize in DAX the red boundary in the screenshot, where measure 2 first exceeds measure 1 (highlighted in yellow), again resetting for every change in year/week and product category. I’m sure there are many other ways to do this, but here’s the approach I took:

Measure 3:
Min Calc Range Grouped =

CALCULATE( 
    MIN( Data[Index] ),
    ALLEXCEPT(
        Data, 
        Data[YEAR_WEEK],
        Data[PRODUCT_CATEGORY]
    )
)

This just calculates the minimum index of the calculation range (the red box), using the repeated ALLEXCEPT pattern.

Measure 4:
Max Calc Range Grouped =

CALCULATE(
    MAX( Data[Index] ),
    TOPN(
        1,
        FILTER(
            ALLEXCEPT(
                Data,
                Data[YEAR_WEEK],
                Data[PRODUCT_CATEGORY]),
            [Cumulative Volume Grouped] > [Total Grouped Volume % Applied]
        ),
        Data[Index],
        ASC
    ),
    ALLEXCEPT(
        Data,
        Data[YEAR_WEEK],
        Data[PRODUCT_CATEGORY]
    )
)

This is the measure the took me most time to figure out - it has a bit of everything – TOP N1, extensive use of the index for positional awareness, the repeated ALLEXCEPT, etc , but was the cornerstone for the remainder of the calculations, as you’ll see below.

Measure 5:
Total Revenue Over Calc Range =

        SUMX(
            FILTER(
                ALLEXCEPT(
                    Data,
                    Data[YEAR_WEEK],
                    Data[PRODUCT_CATEGORY]
                ),
                Data[Index] >= [Min Calc Range Grouped] &&
                Data[Index] <= [Max Calc Range Grouped]
            ),
            [Total Revenue]
        )

This is the sum of P*Q (Total Revenue), filtered by the boundaries of the min and max range, defined by measures 3 and 4 above.

Measure 6:
Total Volume Over Calc Range
This is the exact same measure as above, just with volume instead of revenue.

Measure 7:
Weighted Average Price by Volume =

CALCULATE(
    IF(
        SELECTEDVALUE( Data[Index] ) <= [Max Calc Range Grouped],
        DIVIDE(
            [Total Revenue Over Calc Range],
            [Total Volume Over Calc Range],
            0
        ),
        BLANK()
    ),
    VALUES( Data[Index] )
)

This is the quotient of measures 5 and 6, which generates the volume -weighted average price calculated for the rows of the red box.

I’m sure there are more efficient ways of doing this, but I always find the measure branching approach extremely helpful in breaking down complex problems into manageable chunks. Hopefully, that’s a clear enough explanation to allow you to work through the solution file on your own.

Very interesting problem - I enjoyed working through this one with you. Hope this is helpful to you.

– Brian
eDNA Forum - Complex Ranking Cumulative Scenario - solution.pbix (61.6 KB)

P.S. - Your instincts in Post #1 were spot on (“The solution probably has to deal with a cumulative pattern and a TOPN/RANKX that resets for each YearWeek and ProductCategory.”). That’s exactly what I ended up doing, after a couple of interesting but ultimately unsuccessful detours…:smile:

1 Like

Absolutely epic solution Brian.

Need to get this up on Enterprise Power Users TV

Sam

@BrianJ

Absolutely fantastic!

For the sake of the example I did not provide dates that I have in my own datamodel. The YEAR_WEEK comes from a date table.

I tried your solution with the index but since we work with lots of different product categories and we go up to index 250.000 i’m facing performance issues. Loading the measure “Cumulative Volume Grouped” in the same table you provided in the example is not possible because of forever loading.

Now that you know each orderline has a date that is linked to a date table would you know a solution that takes away performance issues (caused by looping over an index) ?

In the mean time I will write a query based on the data I provided to you. Hopefully that will solve the performance issues.

@BrianJ

Unfortunately due to performance issues I am unable to make it work.
I will give you a little more background that may help working towards a solution.

  • I want to select YEAR_WEEK, PRODUCT_CAT and PERCENTAGE_OF_VOLUME
    Then in the graph I want 2 lines:
    • 1 line showing the average weighted price for the selected product_cat
    • 1 line showing the weighted average price based on the parameter % (basically the solution you provided me)

And regarding the bars it should be a stacked bar with the following data:

  • First part of the bar is Gdp Vol % Applied
  • Second part of the bar is the Vol - Gdp Vol % Applied

Herebelow an example of how it should look like (the line of weighted average price based on parameter is missing)

edna_sample2

From my previous messages I do have a datetable available that may help reaching a better performance. Hopefully you are able to make it work :slight_smile:

@Luukv93,

Almost all of the data sets I work with are relatively small (< 100K records, often much smaller than that). Thus, I’ve had the luxury to date of writing DAX for function and clarity, without much regard to speed/optimization. So, short of running queries to shrink the dataset down to the relevant fields and records prior to loading it into PBI I’m not sure how to substantially improve the performance of the solution I sent you. I know @sam.mckay is working on an Enterprise DNA seminar entitled “Optimizing DAX”, so I expect he will have some excellent input on this question, as may others on the forum.

I would also point you to an excellent presentation that Marco Russo gave at MBAS this year. The link below contains both the video of the talk and Marco’s PowerPoint slides.

I hope this is helpful.

  • Brian

Thanks for your effort @BrianJ you have insane DAX knowledge.

Could you have a look on this? Do you know a way I can optimize this pattern so I can implement the DAX? Maybe a rankx pattern?

Hi ,

Do you happen to have some time to get the pattern to work? performance is unfortunately still a thing and I cannot make it work :frowning:

It seems that measure “Max Calc Range Grouped” causes the performance issues