This thread is getting quite long and I know Brian has already spent a huge amount of time on this.
Any ranking formula in Power BI either TOPN and RANKX has poor performance over large amount of data.
The only way to tried to improve this is to change the virtual table size that the ranking iterates through in the formula. Or alternatively attempt to aggregate your data up into a new physical table, then work out the ranking over that. These are really your two options that I would explore further for this.
Max Calc Range Grouped =
CALCULATE(
MAX( Data[Index] ),
TOPN(
1,
FILTER(
ALLEXCEPT(
Data,
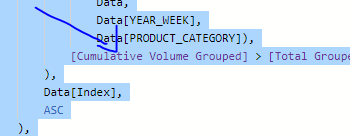
Data[YEAR_WEEK],
Data[PRODUCT_CATEGORY]),
[Cumulative Volume Grouped] > [Total Grouped Volume % Applied]
),
Data[Index],
ASC
),
ALLEXCEPT(
Data,
Data[YEAR_WEEK],
Data[PRODUCT_CATEGORY]
)
)
This most likely is were the slowness is occurring. I would also attempt to break this down and look at it peice by peice, to see which exact part of the formula is causing things to go a bit slower.
I would also say this cumulative total could be the slow part here as well over a large dataset.
See how you go with these ideas.
Thanks
Sam