Greg
October 8, 2023, 9:34pm
2
Hi @lancemillercpa98 .
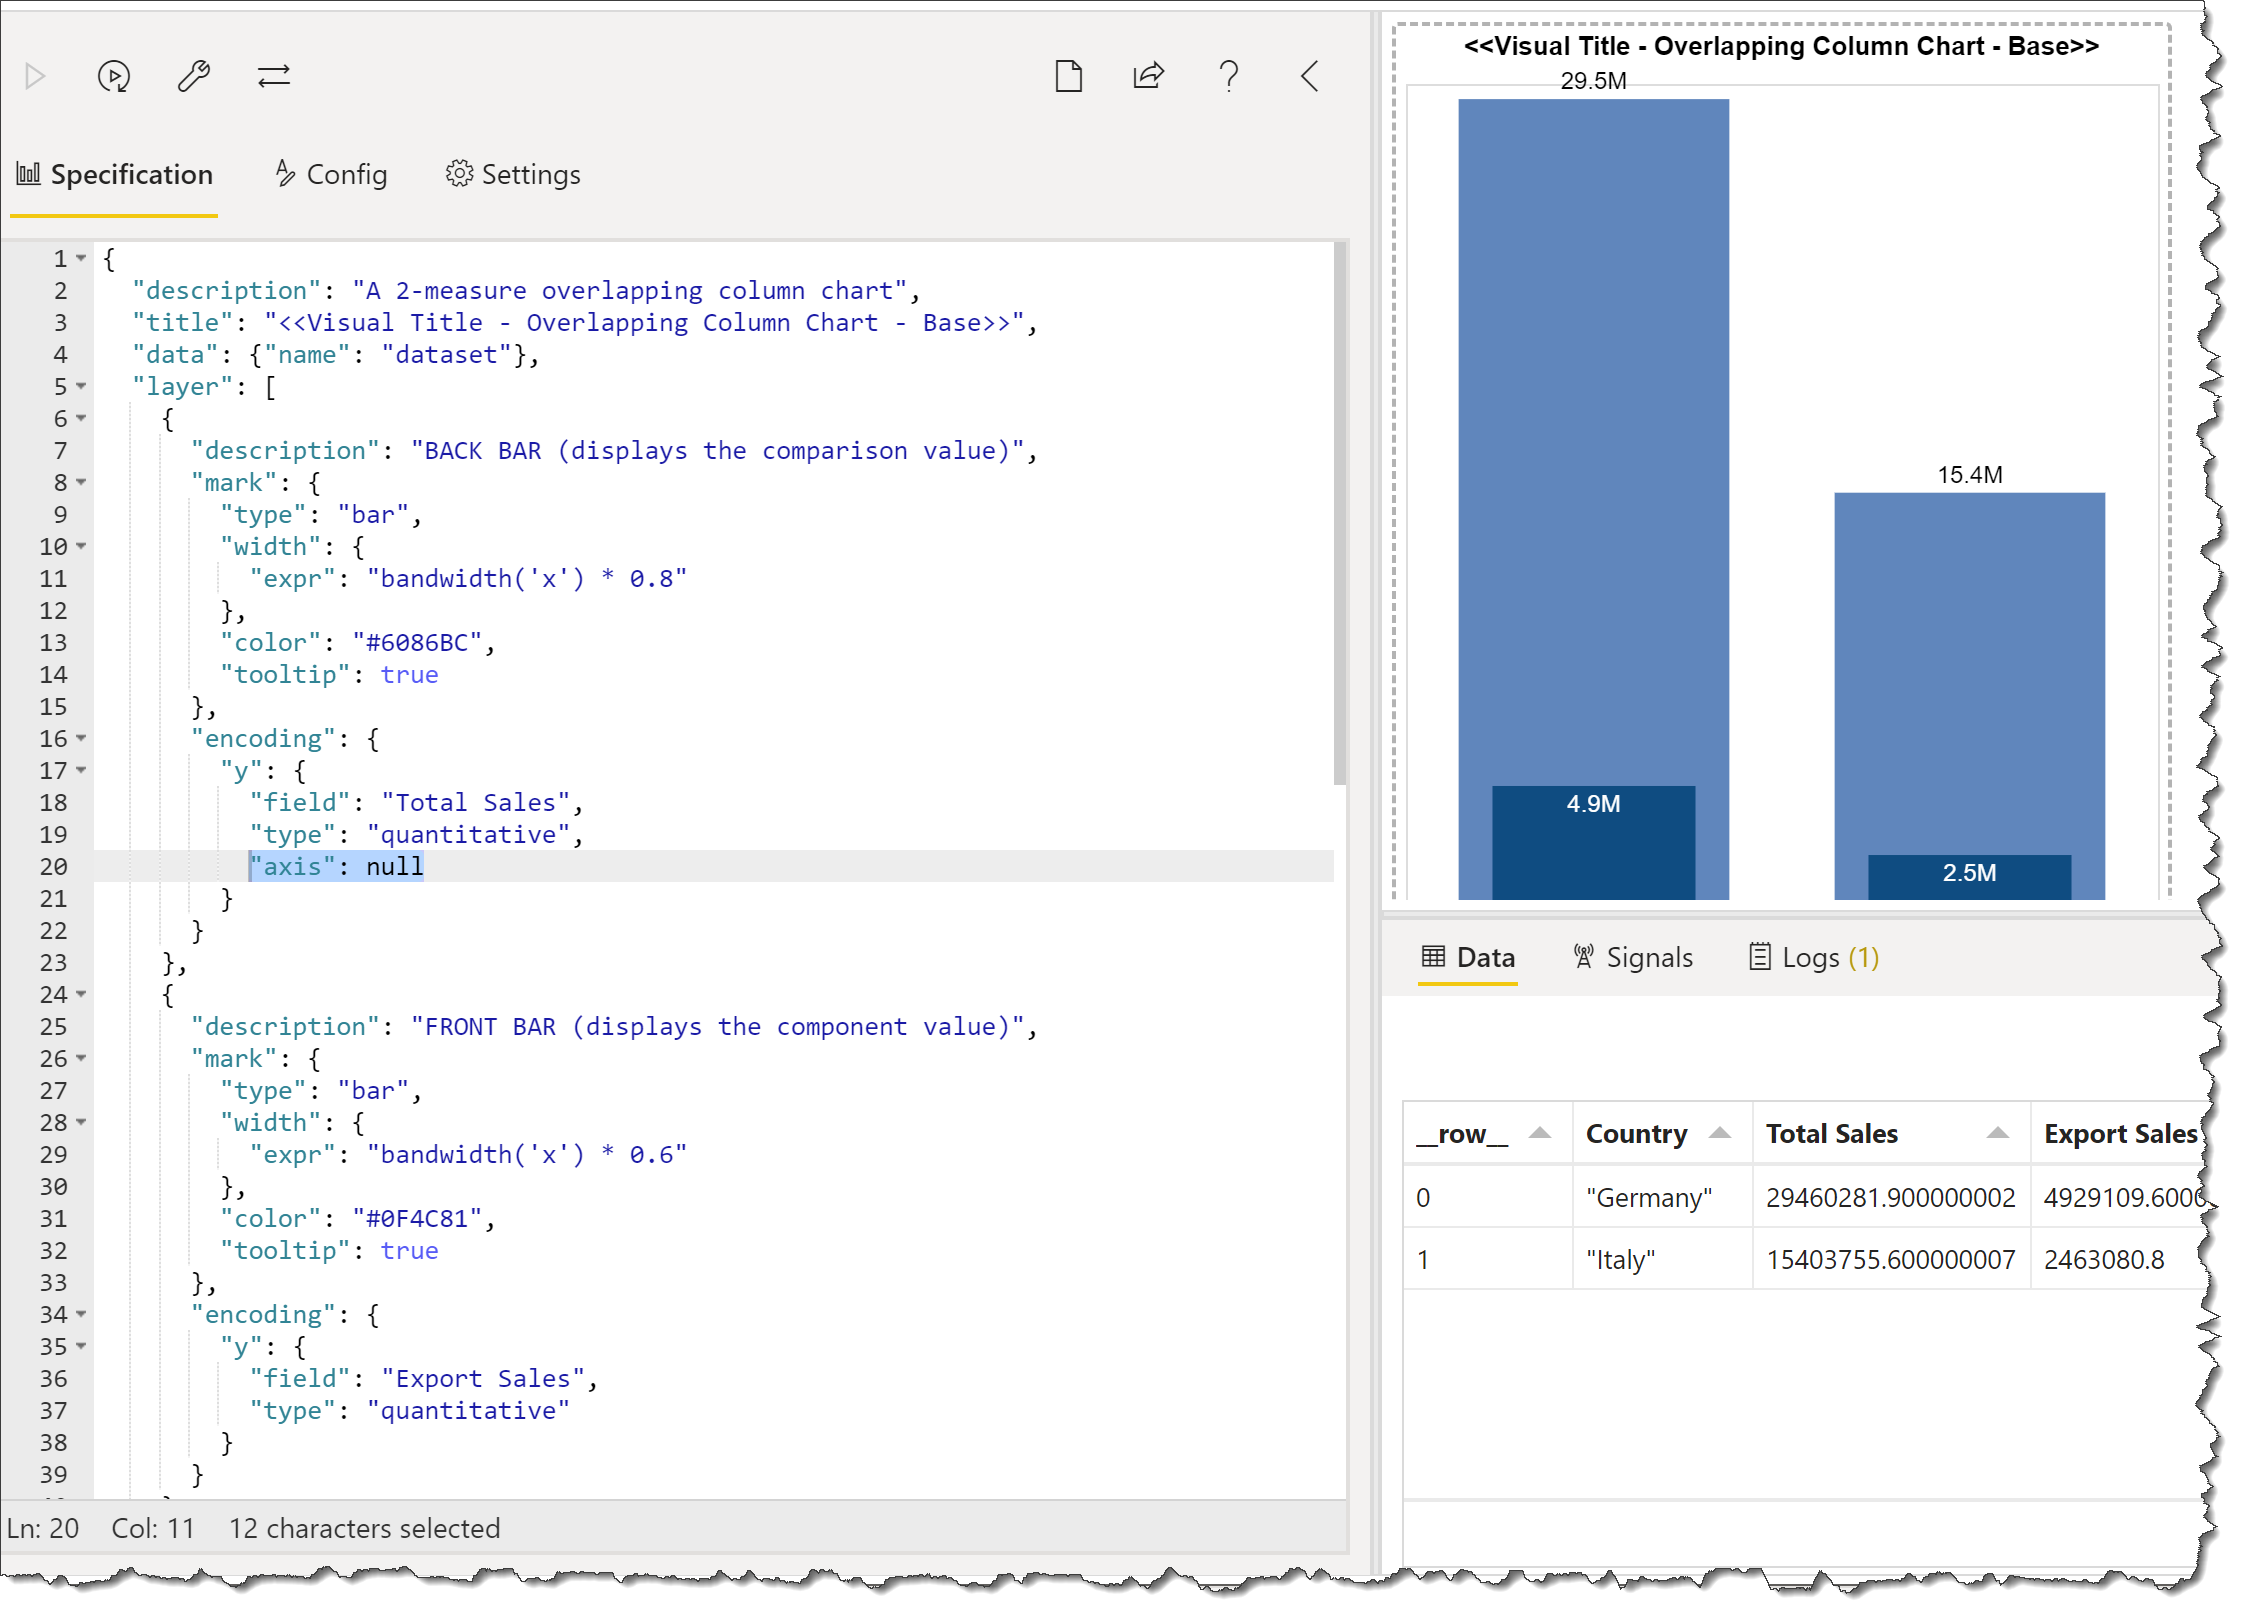
To turn off axis titles, add an axis-null key:value pair to the appropriate axis in the encoding block; here’s an example with the Y-axis turned off:
For additional comparisons, you can add other bar marks or tick marks as desired. Here’s a 4-bar/1-tick example of a bullet chart that may be of some interest.
The standard clustered bar chart in Power BI can be used to display a group of measure values for a set of categories, for example the channel sales for a country. An alternative could be a bullet chart with separate bars for the total and channel sales, and I enclose a Deneb/Vega-Lite template for a bullet chart displaying not only the total and channel sales, but a vertical bar at the 50% mark of total sales to add context.
[deneb.bullet_chart.0.2]
This template illustrates a number of Deneb…
Hope it helps.eDNA Forum - Deneb Overlapping Column V2.pbix (1.6 MB)