Measures not calculating sum in matrix

Hi Sam
I know about the mismatched dates. At this stage that is not important as I won’t be going back that far. (2018 - 5 = 2013). I plan to actually filter that in the Query Editor later but wanted all the data there for my testing.

I understand what you are referring to when you say the measure is not on the page. That is correct. I created a new page and put it on there for my testing. That is when I got the skew results.

What I want to achieve is this:


where the month column being used changes depending on the month of date filtered on the funnel tab.

Thanks

Hi Sam
I have tried the DAX
It doesn’t give the right totals.
The original where the four years are manually selected


The total is correct with 90 entrants

and the new one where the years are being calculated.


All the results are wrong, most obviously the total.
Thanks

I’m sorry I’m lost now.

There’s two things here and I’m not sure on both of them where to next as I don’t quite understand what’s required exactly.

Can we simplify this somehow.

You’got these arrows pointing to here, but then the calculations are wrong from what I can tell?

image

I also can’t replicate this table?

image

I thought you wanted a calculation that looked at the minimum year and then jumped back 4 year from then?

Hi Sam,
Things have got way more complicated (because they were not complicated enough !)
I was on the understanding that they wanted to use the enrolment date as a basis for all calculations. This was incorrect.

There is another date in the original table that I filtered out - the confirmation date.

This date is what is used to calculate the pivot table months (the confirmation month). I have brought this date back in and created a second relationship. I have just started the process of updating the DAX to use the inactive relationship.

Number of Entrants = 
CALCULATE(
    COUNT('Average Entrance'[ID]),
    USERELATIONSHIP(Dates[Date],'Average Entrance'[Confirmation Date])
)

Still working on the average entrants to get the right average and then the cumulative results - which are currently wrong.

Once I get them right, I need them to be the Entrants Forecast column

Thanks

Ok yes that looks right technique for turning on the inactive relationships

Hi Sam,
Its all good in theory.
I get the number of entrants correct


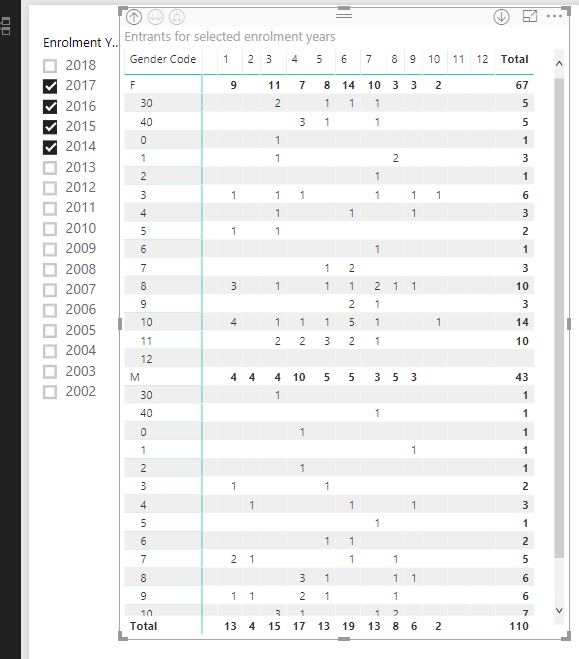
but the average is up the creek.

Average = 
CALCULATE(
    AVERAGEX('Average Entrance', [Number of Entrants]),
    USERELATIONSHIP(Dates[Date],'Average Entrance'[Confirmation Date])
)

Last I checked 2 / 4 is 0.5 - not 1.0

I’ll need to look at the file.

You can add it to the forum post now

Hi Sam,
I have managed to fix the summary average issue. It was a date context issue. I needed to remove it from the calculation and use the number of years that have been selected.

Now all the summary information is correct. I just have to transpose the cumulative total for the relevant year and month selected into the right area in the main table.

I have uploaded the file Fun.pbix (797.2 KB)

Thanks

Hi Sam,
One more thing I should note. The Enrolment years chosen are the years prior to the year chosen in the funnel.
That is, if I choose Mar 2018, the enrolment years need to be 01/01/2014 - 31/12/2017

Regards

Hi Sam,
So close.

Other than the total at the bottom it works with Year Level Code,

there is one more strange behaviour that I can not pinpoint.

When I switch between forecast and confirmed results which is supposed to switch the Selected Entrants value between the Confirmed Entrants and the Forecast Entrants formulas, the base totals break.

It works fine for confirmed, but not for forecast. However, the EOY forecast is correct in both cases and the base totals are now based on that!

File attached.

Fun.pbix (795.7 KB)

Thanks again

This is very complex with everything that’s going on here. I have to be honest it’s tough to understand all the moving parts being relatively unfamiliar with all the data, even though I’ve spent many hours on this now.

I think we just have to work logically through what the calculation is doing in the context of the total and try figure it out from there.

In the total field the SUMMARIZE function is building a virtual table of all the months in that particular context. The only month in the context though is March at the moment

image

So the table will only be one row.

Average Entrants will then be working out the below

image

I believe it’s likely to be the SUMX part of this formula.

Which is then jumping back to this part of the formula

This is where I’m lost. It’s way too complex to understand here.

We’re jumping back to about three different branches.

I truly would start again and build this one formula from scratch and not have it jumping between all of these, as I’m sure your struggling to understand every calculation as well.

I would create every calculation you need in the one formula for ‘Forecast Entrants’

This would make the number much easier to audit

Sam

Hi Sam,
I have attempted your suggestion.
As you said, there is a lot going on in this formula.
It is attempting a lot.
It first calculates the number of entrants for the timeframe selected , then averages those entrants across that timeframe to get a monthly average.
The final step is to calculate a cumulative total of those averages.
Hideously complex

Forecast Entrants Test = 
// Calculate timeframe for entrants. Previous year backdated by number of years selected
VAR MinYear = CALCULATE( MIN(Dates[Year]), ALLSELECTED(Dates) )
VAR StartYear = MinYear - [Back Year Selection]
VAR FinishYear = CALCULATE( MAX(Dates[Year]), ALLSELECTED(Dates) ) - 1
VAR DateRange = 
    FILTER(
        ALL(Dates),
        Dates[Year] >= StartYear && Dates[Year] <= FinishYear
    )

// Calculate the number of entrants in the given period
VAR NumberOfEntrants = 
    CALCULATE(
        COUNT('Average Entrance'[ID]),
        USERELATIONSHIP(Dates[Date], 'Average Entrance'[Confirmation Date])
    )

// Calculate the monthly average 
VAR MonthlyAverage = DIVIDE(NumberOfEntrants, [Back Year Selection], 0)

// Calculate the average total so that the column totals work
VAR AverageTotal = 
    SUMMARIZE(
        'Average Entrance', 
        'Average Entrance'[Year Level], 
        "Monthly Avg", MonthlyAverage
    )
VAR AverageEntrants = 
    IF(
        HASONEVALUE(Dates[Month Of Year]),
        MonthlyAverage,
        SUMX(AverageTotal, [Monthly Avg])													
    )                            

RETURN
// Round up the total to the nearest whole number (can't have a partial person)
ROUNDUP(
    // Calculate the cumulative total of the monthly average
    SUMX(
        SUMMARIZE(
            DateRange, Dates[Month Name],
            "Av Entrants", AverageEntrants,
            "MonthNumber", MIN(Dates[Month Of Year])
        ),
        [Av Entrants]
    ),
    0
)

I think the problem is coming in the NumberOfEntrants area. The context is only the current date, not the whole DateRange. I have yet to figure out how to modify the context to use an inactive relationship with the DateRange.

Thanks

Ok I’m still just trying to break this down to then build back up.

Highly recommend breaking things out and working on by one. The other problem placing variable all in the one formula is you can’t work out there behaviour.

All I’m reviewing first is this formula

Number of Entrants =
CALCULATE( COUNT(‘Average Entrance’[ID]),
USERELATIONSHIP(Dates[Date], ‘Average Entrance’[Confirmation Date]) )

And it returns this table.

This seems way off from what your trying to solve from what I can tell, so I think this is a good place to start.

Is this right?

Hi Sam
That is exactly what I got which is why I narrowed it down to that area.
It appears to be only using the current year in the calculation not the correct date range ( 2015-2017)
Thanks

Hi Sam,
I have been playing around with this measure to try and see if I can get it working.
It is definitely the root of the problem.

I isolated just the part that calculated the number of entrants to test and attempted to add the date range in.

Number of entrants test = 
// Calculate timeframe for entrants. Previous year backdated by number of years selected
VAR MinYear = CALCULATE( MIN(Dates[Year]), ALLSELECTED(Dates) )
VAR StartYear = MinYear - [Back Year Selection]
VAR FinishYear = CALCULATE( MAX(Dates[Year]), ALLSELECTED(Dates) ) - 1
VAR DateRange = 
    FILTER(
        ALL(Dates),
        Dates[Year] >= StartYear && Dates[Year] <= FinishYear 
    )

// Calculate the number of entrants in the given period
VAR NumberOfEntrants = 
    CALCULATE(       
        COUNT('Average Entrance'[ID]),
        DateRange
    )
    
RETURN
NumberOfEntrants

The result was a table of the end of year results, not the selected month (eg march).
I modified it to include the selected month.

Number of entrants test = 
// Calculate timeframe for entrants. Previous year backdated by number of years selected
VAR MinYear = CALCULATE( MIN(Dates[Year]), ALLSELECTED(Dates) )
VAR StartYear = MinYear - [Back Year Selection]
VAR FinishYear = CALCULATE( MAX(Dates[Year]), ALLSELECTED(Dates) ) - 1
VAR FinishMonth = SELECTEDVALUE(Dates[Month Of Year])
VAR DateRange = 
    FILTER(
        ALL(Dates),
        Dates[Year] >= StartYear && Dates[Year] <= FinishYear && Dates[Month Of Year] <= FinishMonth
    )

// Calculate the number of entrants in the given period
VAR NumberOfEntrants = 
    CALCULATE(       
        COUNT('Average Entrance'[ID]),
        DateRange
    )
    
RETURN
NumberOfEntrants

The theory behind this is that I would not need to calculate beyond the same month the previous year to get me valid results.

The results were closer, but not quite right.
They should look like this

but look like this

Once I get that bedded down, then I will be able to move onto the averages and cumulative averages.

Thanks
Fun.pbix (931.4 KB)

Hi Sam,
You’re probably getting sick of me.
I’m getting so close now…
I have modified the Number of Entrants DAX

Number of entrants test = 
// Calculate timeframe for entrants. Previous year backdated by number of years selected
VAR YearStartDate = STARTOFYEAR(Dates[Date])
VAR YearEndDate = ENDOFYEAR(Dates[Date])
VAR StartDate = DATE(YEAR(YearStartDate) - [Back Year Selection], MONTH(YearStartDate), DAY(YearStartDate))
VAR EndDate = DATE(YEAR(YearEndDate) - 1, Month(YearEndDate), DAY(YearEndDate))
VAR DateRange = 
    FILTER(
        ALL(Dates),
        Dates[Date] >= StartDate 
            && Dates[Date] <= EndDate
    )

// Calculate the number of entrants in the given period
VAR NumberOfEntrants = 
    CALCULATE(
        COUNT('Average Entrance'[ID]),
        DateRange,
        VALUES(Dates[Month Of Year]) // Bring the months back into the equation
    )
        
RETURN
NumberOfEntrants

The trick was to bring the months back in.
This gives me the correct total for the months chosen.

What puzzles me is that this is still the only month. I would have thought that by releasing the date context with ALL(Dates) I would have been able to see all months despite the dates slicer.

This means that my cumulative values are not correct.

So close … yet still not there.

Thanks

Ok this is looking a lot cleaner.

It looks like to me you’ve built your date range, which should flow down into the last variable. But then you’ve bought back the month & year context with VALUES. So whatever that is (because I can’t tell) is placing a filter back onto the result.

Is that what you really need? The ALL takes away the filter but you’ve bought back a specific one, which is a very specific time frame.

Maybe you just want to bring back the month not the month & year? It’s hard for me to say exactly.

Hi Sam,
I am bringing back Month of year (1 … 12) not Month and year.

Right, sorry I see, my mistake.

Still a bit lost. I would have to test this myself.

Can you just remind me exactly what you are trying to calculate here as well, just as been through a number of iterations and need to understand it again.

Hi Sam
Not surprising. This is doing my head in too.
On the tab Average Entrance 2 I have the base calculations where there is no month selected. You will see that the number table has the numbers per month.
The average table averages them over the number of years forecast (in this case 4).
What is messed up is the cumulative table. Where those number are coming from is anyone’s guess.
This is where I got to last night. I just have to fix this to get the cumulative totals right.

Then on the Funnel tab is the next weirdness.
I have modified the PY Girls / PY Boys measure to be based on the EOY Forecast measure rather than the Count Student Measure. The EOY Forecast measure just switches between forecast and confimed.

Everything is fine with confirmed. Forecast is totally bonkers! I can’t see why.

File attached.Fun.pbix (932.8 KB)