I’m having one of those days where my head is struggling to conceptualize DAX.
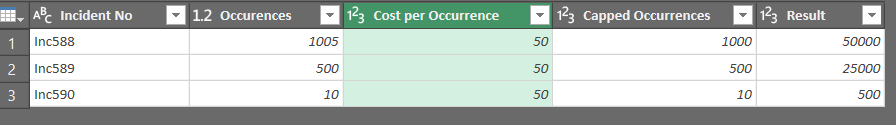
I need to create a measure where I have the Number of Occurrences * by the Cost Per Occurrence. So far, so straightforward. However, Occurrences are capped at 1000 per incident so the maximum cost will be 1000 * £50.00. Usually I’ll only have one row per Incident Number but occasionally they can be split over two or more rows so for INC588 it has two entries, one of 990 and one of 15.
Ha! You beat me to it - I was just finishing my power query solution when I saw you posted yours. For the sake of completeness, and not letting it go to waste here’s my PQ solution:
let
Source = Table.FromRows(Json.Document(Binary.Decompress(Binary.FromText("i45W8sxLNrWwUNJRsrQ0AJKmBnoGINrEUsfUAMyO1UFSZGiKpMbcFFWBJVgO2RQjUx0DVFPAlhgiq4FZEwsA", BinaryEncoding.Base64), Compression.Deflate)), let _t = ((type nullable text) meta [Serialized.Text = true]) in type table [#"Incident No" = _t, Occurences = _t, #"Cost per Occurrence" = _t, Cost = _t]),
#"Changed Type" = Table.TransformColumnTypes(Source,{{"Incident No", type text}, {"Occurences", Int64.Type}, {"Cost per Occurrence", Currency.Type}, {"Cost", Currency.Type}}),
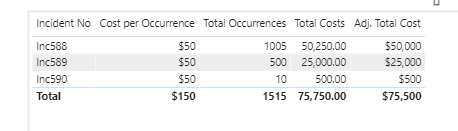
#"Grouped Rows" = Table.Group(#"Changed Type", {"Incident No", "Cost per Occurrence"}, {{"Total Occurrences", each List.Sum([Occurences]), type nullable number}, {"Total Costs", each List.Sum([Cost]), type nullable number}}),
#"Added Custom" = Table.AddColumn(#"Grouped Rows", "Max Occurrences", each 1000),
#"Added Custom1" = Table.AddColumn(#"Added Custom", "Adj. Total Cost", each if [Total Occurrences] >= [Max Occurrences] then [Max Occurrences] * [Cost per Occurrence] else [Total Costs])
in
#"Added Custom1"
I’ll take a look at the Power Query solutions, I’ve had to build something in DataFlows and my queries are completed so unsure if I’ll go back and change anything there.
Will definitely look through all the suggested ways of solving this for the learnz!
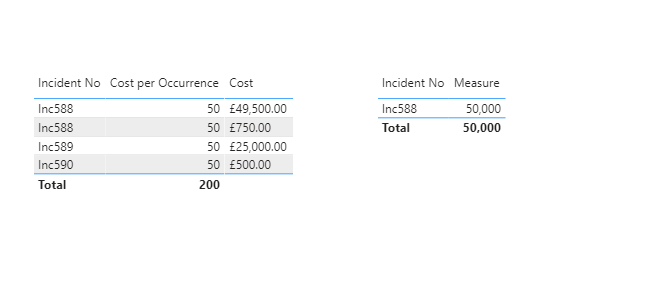
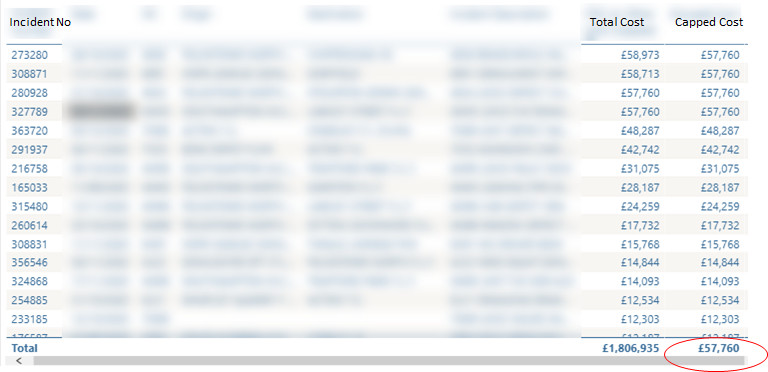
@MudassirAli Your solution work 95% of the way for me as you can see. My hourly cost is actually £57.60 as went for simplicity with £50 in the example I posted.
In the picture I’ve posted I get the cap applied to the Total column at the bottom, is there a way that the measure can sum up the incidents also? I’d like to use the Measure in a KPI card also but it will obviously apply the cap there also.
Hope I made sense. Thanks again.
MeasureR =
VAR GroupSum =
CALCULATE (
SUM ( Sheet1[Occurences] ),
ALLEXCEPT ( Sheet1, Sheet1[Incident No] )
)
VAR Conditionz =
IF ( GroupSum > 1000, 1000, TotalOccurencesMeasure )
VAR Result =
Conditionz * SELECTEDVALUE ( Sheet1[Cost per Occurrence] )
RETURN
Result
@DavieJoe You know it’s Thursday when you are unable to understand a simple requirement as your brain is tired and really looking forward for the weekend . Yes, that’s what has happened and I am sorry as I am really unable to understand the new requirement of a measure in a card. It would really help if you could elaborate more on this one.
@MudassirAli You’ve got no need to apologise as you’ve been fantastic help in this question (and any others I’ve asked). It’s more likely my shoddy explanation
The Capped Cost works beautifully in my individual table rows so thank you on that. I was just wondering if it is possible for the total of the table to reflect the sum of all the individual rows in the table, instead the total row will follow the logic of the cap and max out at 1000 Occurrences * the Cost per Occurrence but I understand it’s to do with the filter context and the SELECTEDVALUE.
Incident No
Total Cost
Capped Cost
Incident No
Total Cost
Capped Cost
273280
£58,973
£57,760
273280
£58,973
£57,760
308871
£58,973
£57,760
308871
£58,973
£57,760
280928
£57,760
£57,760
280928
£57,760
£57,760
327789
£57,760
£57,760
327789
£57,760
£57,760
363720
£48,287
£48,287
363720
£48,287
£48,287
Total
£281,753
£57,760
Total
£281,753
£279,327
I’d want my card measure to calculate the total of all incidents as the above table on the right hand side with a total of £279,327 as per the example and not capping itself at £57,760.
I don’t want to step on the great work that @MudassirAli is doing in this thread, and I’m sure he will provide you with an excellent solution on the above question. However, I thought this post might provide you some good background info on building the necessary evaluation context via virtual tables within measures for card visuals, per your requirement above and potentially give you the ability to solve it yourself:
Yup, give it a go. It’s a can’t lose strategy - either you solve it yourself, or you don’t - but in the latter case your understanding of @MudassirAli’s solution will be far deeper.
@MudassirAli A big thank you, for some reason I’ve hit a real mental block of late in trying to up my DAX skills. Thanks again for the time you’ve taken to help me.
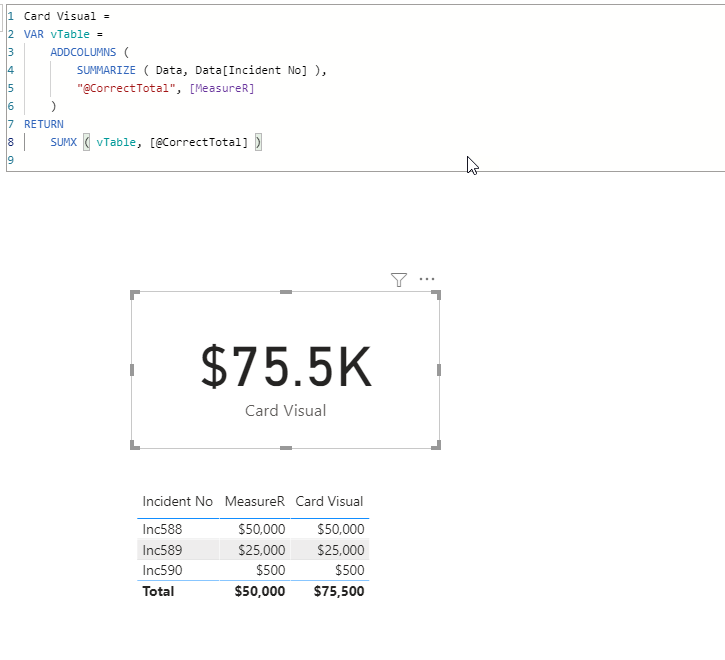
VAR vTable is our virtual table
Summarize groups our Incident No.s to distinct values
We create a new “internal measure” called @CorrectTotal and then we drop in our capped measure.
The SUMX then iterates through our virtual table capping each incident according to our capped measure

 . Yes, that’s what has happened and I am sorry as I am really unable to understand the new requirement of a measure in a card. It would really help if you could elaborate more on this one.